
- Title
-
TP53 Modulates Oxidative Stress in Gata1+ Erythroid Cells.
- Authors
- Kramer, A.C., Weber, J., Zhang, Y., Tolar, J., Gibbens, Y.Y., Shevik, M., Lund, T.C.
- Source
- Full text @ Stem Cell Reports
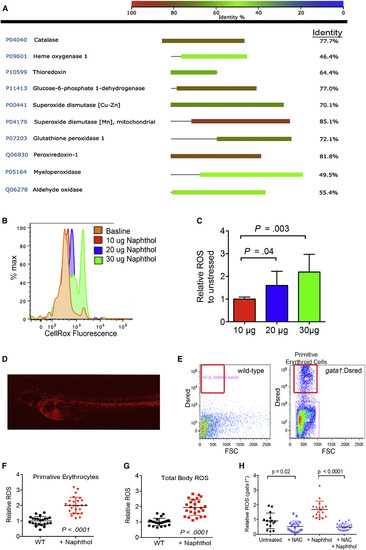
Oxidative Stress in gata1+ Erythroid Cells (A) BLASTP identity analysis of key proteins involved in the oxidative stress response between Danio rerio and Homo sapiens. (B) Representative flow cytometry histograms showing CellRox emission in 72 hpf embryos after 48 hr of 1-naphthol exposure (concentrations shown as μg per 5 mL). (C) Quantification of CellRox probe signal MFI relative to unstressed embryos. n = 20 individual animals per condition showing one of five independent experiments. (D) Live imaging of a gata1:DsRed transgenic zebrafish at 72 hpf indicating DsRed-positive primitive erythroid cells. (E) Representative flow cytometry of single-cell suspensions prepared from wild-type and gata1:DsRed zebrafish at 72 hpf. (F and G) Pro-oxidant exposure induces ROS in Gata1+ erythroid precursors. Animals were exposed to 20 μg/5 mL 1-naphthol followed by flow cytometry of Gata1+ erythroid cells by gating on DsRed-positive cells (or all cells for total-body ROS) and measuring CellRox probe MFI to determine ROS. n = 20–25 individual animals per condition showing one of four independent experiments. (H) NAC combined with 1-naphthol reduces ROS in Gata1+ erythroid cells. All pro-oxidant exposure times were from 24 to 72 hpf. All data are shown as the mean ± SD, with the p value from a Student t test. See also Figure S1. |

Gata1+ Erythroid Cells Contribute a Significant Proportion of ROS to Total-Body ROS (A) Gata1+ primitive erythroid cells contribute to total ROS. Cells from stressed gata1:DsRed zebrafish were gated initially for the total cell population, then evaluated by cumulative distribution function of CellROX green ROS probe signal. The 20th to 80th percentiles of ROS signal were gated, and the makeup of each percentile in terms of the gata1:DsRed fraction of all cells was determined. n = 20–25 individual animals per condition showing one of three independent experiments. (B) Makeup of each percentile of ROS probe signal in terms of % gata1:DsRed contribution showing that the highest ROS signal originates mostly from Gata1+ erythroid cells. One-way ANOVA indicates p value < 0.0001 for overall effect and p < 0.001 in two-way comparisons between all groups. (C) o-Dianisidine-stained vlad tepes zebrafish at 72 hpf showing a lack of erythrocytes. Scale bars represent 500 μm. (D) Vlad tepes zebrafish have reduced total-body ROS. Vlad tepes and phenotypically normal clutch mates were treated with 20 μg/5 mL 1-naphthol followed by flow cytometry of total-body ROS indicated by CellRox ROS probe (n = 17–22 individual animals per condition in one of two experiments). All pro-oxidant exposure times were from 24 to 72 hpf. All data are shown as the mean ± SD, with the p value from a Student t test, unless otherwise noted. |

Oxidative Stress Induces tp53, which Can Modulate ROS Levels (A) Zebrafish show increased 8-oxo-dG after pro-oxidant exposure (1-naphthol at 20 μg/5 mL). n = 5–6 per condition, one of two independent experiments. (B) Representative image of a TUNEL assay from zebrafish after pro-oxidant exposure (20 μg/5 mL). Boxed region indicates the CHT. Scale bar represents 500 μm. (C) Number of TUNEL-positive cells present in the CHT. n = 14–16 individual animals per condition in one of two independent experiments. ∗p < 0.0001. (D) Heatmap of RNA-seq data from untreated and 1-naphthol-treated zebrafish. Unsupervised clustering was performed on genes with log2 expression >2-fold difference. (E) Distribution of genes with log2 expression >2-fold difference between control and 1-naphthol-treated zebrafish. n = 5 control animals and n = 6 naphthol-treated animals. (F) IPA results of the significant Upstream Regulators having greater expression in 1-naphthol-treated zebrafish. (G) RT-PCR of tp53 in zebrafish after pro-oxidant exposure (n = 20 individual animals per group, technical duplicates, pooled from four independent experiments). ∗p < 0.05, ∗∗p < 0.01. (H) Tp53 inactivation using pifithrin (PFT) during pro-oxidant exposure (1-naphthol at 30 μg/5 mL) at 1 μM final concentration increases ROS in Gata1+-expressing erythrocytes. ROS measured using the CellRox ROS probe relative to untreated group. n = 20–25 individual animals per condition showing one of three independent experiments. See also Figure S2G. (I) Elevated ROS in tp53M214K zebrafish Gata1+-expressing erythroid cells after pro-oxidant challenge. n = 20–25 individual animals per condition showing one of three independent experiments. (J) Erythroid progenitors in TP53R270H/+murine whole bone marrow have increased ROS generation after short-term oxidative challenge. After exposure to 1 mM acrolein, nucleated CD71+ cells were gated by flow cytometry (see Figure S2H for gating) and ROS measured using CellROX green probe. ROS is given relative to the untreated group. Shown are data pooled from two independent experiments. All zebrafish pro-oxidant exposure times were from 24 to 72 hpf. n = 10–20 individual animals per condition pooled from two independent experiments. All data are shown as the mean ± SD, with the p value from a Student t test. |

Genetic Inactivation of tp53 Leads to Elevated ROS, Cell Death, and Increased Mitochondrial Basal OCR (A) Relative erythroid cell death indicated by propidium iodide staining cells after 1-naphthol exposure (20 μg/5 mL) and quantified by flow cytometry. n = 20–21 individual animals per group pooled from two independent experiments. (B) Pro-oxidant exposure (0–30 μg/5 mL) leads to increased death and edema in tp53M214K/M214K zebrafish (mutants denoted as tp53m/m). Embryos were scored at 96 hpf (after 72 hr of pro-oxidant exposure). n ≥ 100/individual animals per group, p value from chi-square analysis. Data pooled from three independent experiments. (C) Severe hemolytic edema in tp53M214K/M214K zebrafish exposed to 1-napthol (20 μg/5 mL). Hemoglobin staining was performed using o-dianisidine. (D) Heatmap of RNA-seq data from untreated and 1-naphthol-treated tp53M214K/M214K zebrafish (treated from 24 to 72 hpf). Unsupervised clustering was performed on genes with log2 expression >2-fold difference. n = 5 individual animals in each group. (E) GO term analysis using the PANTHER database and software for GO enrichment analysis for biological process indicates genes involved in metabolism are highly upregulated in tp53M214K/M214K after pro-oxidant challenge. (F) Live image displaying erythroid precursors from gata1:DsRed × mito:GFP zebrafish at 72 hpf. Imaging performed with a Leica TCS SPE Spectral Confocal system. Scale bar represents 25 μm. (G) Mitochondrial content of gata1:DsRed × mito:GFP and gata1:DsRed × mito:GFP × tp53M214K zebrafish. Single-cell suspensions at 72 hpf were made and mitochondrial content determined by flow cytometry measuring GFP MFI. n = 18–20 individual animals per group in two independent experiments. (H) Lack of OXPHOS reserve in tp53M214/M214KK zebrafish. Mitochondrial OCR was measured using the Seahorse biochemical analyzer. Yellow bars indicate the amount of reserve OXPHOS, which is the difference between maximal OCR and basal OCR. Shown are the mean and SEM. n = 12–15 individual animals per group in two independent experiments. See also Figure S3D. (I) Basal OCR is higher in tp53M214K/M214K zebrafish. Shown are the means and SD. n = 12–15 per group showing one of two independent experiments. (J) Quantification of OXPHOS reserve indicates tp53M214K/M214K zebrafish have no reserve. Shown are the means and SD. n = 12–15 per group showing one of two independent experiments. All pro-oxidant exposure times were from 24 to 72 hpf, except (C) and (I and J), which were from 24 to 96 hpf and from 24 to 120 hpf, respectively. (K) Pro-oxidant exposure (20 μg/5 mL) combined with oligomycin exposure leads to decreased death and edema in tp53M214K/M214K zebrafish. Embryos scored at 96 hpf after 72 hr of drug exposure. n ≥ 100/individual animals per group, p value from chi-square analysis. Data pooled from three independent experiments. |

(A) Acridine orange staining of stressed gata1:DsRed zebrafish indices cell death occurring in Gata1+ erythroid cells of the HCT. At 24 hpf, gata1:DsRed zebrafish were dechorionated and treated with 20 μg/5 mL 1-naphthol as before. At 72 hpf, the zebrafish were incubated in a solution of 1 μg/mL acridine orange (Sigma Chemical) dissolved in fish water for 40 minutes in the dark, and followed by three 5minute washed with fish water. The zebrafish were then anesthetized using Tricane (200 μg/mL) and embedded in 1% low melting agarose for imaging. Image acquisition to show the caudal hematopoietic tissue (CHT) region, was performed using a Leica DMI 6000 inverted epifluorescent microscope. Red, green, and composite fluorescence images were taken to identify Gata1+ erythroid cells (red) and overall cell death (green). Dying Gata1+ erythroid cells are shown in the overlay as yellow. Scale bar indicates 500 micros. (B – F) At 24 hpf, gata1:DsRed zebrafish were dechorionated and treated with 20 μg/5 mL 1-naphthol as described in the Methods. At 72 hpf Gata1+ erythroid cells were sorted on a BD FACSAria II (BD Biosciences, San Jose, CA) into RNAlater (ThermoFisher Scientific, Waltham, Massachusetts) and RNA prepared according to the manufacture’s instructions. qRT-PCR of sorted cells was performed on a StepOne Plus thermocycler (Applied Biosystems, Waltham, Massachusetts ) using Taqman primer/probes sets (Dr03136839_m1 for sesn2, Dr03131895_m1 for nrf2 (nef2), Dr03434097_m1 for hmox1, Dr03146792_m1 for txn, and Dr03112085_m1 for tp53; all from ThermoFisher Scientific. n = 15 – 20 individual animals per group, technical duplicates, pooled from two independent experiments. (G) Tp53 inactivation using Pifithrin (PFT) during pro-oxidant exposure (1-naphthol at 30 μg/5 mL) at 1 μM final concentration increases ROS in Gata1+ expressing erythrocytes. PFT was refreshed every 4 hours from 24 hpf to 72 hpf. ROS measured using the CellRox ROS probe relative to untreated group. One of three independent experiments. n = 20 – 30 individual animals per group showing one of two independent experiments. (H) Flow cytometry histoplot of murine marrow cells stained with anti-CD71 (red) versus isotype control (blue). CD71 positive events were next assessed for ROS using CellRox Green and measuring mean fluorescence intensity. Blue histogram shows cells from a Tp53R270H/+ mouse without ROS induction. Green histogram shows CD71+ cells after treatment with 1 mM acrolein with increased ROS. All data are shown as the mean ± SD, with the p-value from a Student’s t-test (unless otherwise indicated). |