
- Title
-
Correction: Somite-Derived Retinoic Acid Regulates Zebrafish Hematopoietic Stem Cell Formation
- Authors
- Pillay, L.M., Mackowetzky, K.J., Widen, S.A., Waskiewicz, A.J.
- Source
- Full text @ PLoS One

Shown are representative 17 hpf embryos following |

(A-C’) Representative flat-mount 17 hpf embryos following |

RA does not regulate the somitic expression of Wnt16-Notch3 signaling pathway components. Shown are representative 17 hpf embryos following in situ hybridization analyses (A-J’). Lateral view (A-J) or dorsal view (A’-J’) of gene expression is shown with anterior oriented to the left. A’-J’ represent different views of the embryos shown in A-J. Compared to DMSO-treated controls (A, A’, C, C’, E, E’, G, G’), DEAB-treated embryos exhibit normal somitic expression levels of wnt16 (B, B’), and dlc (D, D’), mildly increased dld expression (F, F’), and increased notch3 somitic gene expression (H, H’). DEAB-treated embryos also exhibit normal expression levels of the Notch3 signaling pathway transcriptional target her9 (J, J’), when compared to DMSO-treated controls (I, I’). (K) Quantitative real-time PCR analysis of her9 expression in 17 hpf DMSO-treated controls and embryos treated with 5 μM DEAB. Shown is the relative quantity of her9 expression. Samples were normalized to ef1a and DMSO-treated was set to 1. Error bars indicate standard error of the mean. *Indicates the difference compared to control is significant by Student t test, P = 0.0198. |
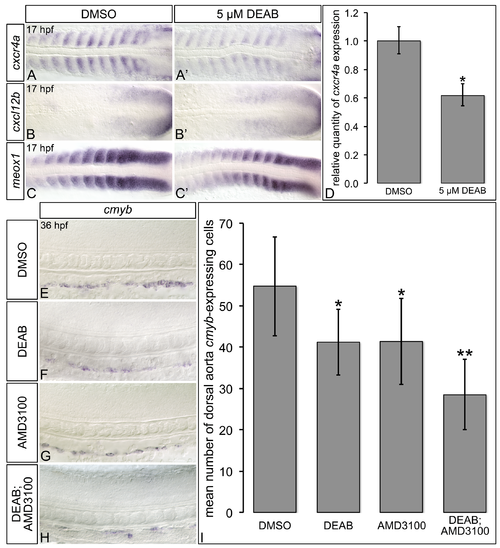
RA-deficient embryos exhibit altered Cxcl12b chemokine signaling pathway component gene expression. (A-C’) Representative flat-mount 17 hpf embryos following in situ hybridization analyses. Dorsal of gene expression is shown with anterior to the left. Compared to DMSO-treated controls (A), embryos treated with 5 μM DEAB (A’) exhibit strongly reduced somitic cxcr4a gene expression, and narrowing of the cxcr4a expression domain within each somite. Compared to DMSO-treated controls (B, C), embryos treated with 5 μM DEAB exhibit subtly increased levels of somitic cxcl12b expression (B’), and subtly decreased levels of somitic meox1 expression (C’). (D) Quantitative real-time PCR analysis of cxcr4a expression in 17 hpf DMSO-treated controls and embryos treated with 5 μM DEAB. Shown is the relative quantity of cxcr4a expression. Samples were normalized to ef1a and DMSO-treated was set to 1. Error bars indicate standard error of the mean. *Indicates the difference compared to control is significant by Student t test, P < 0.0382. (E-H) Representative flat-mount 36 hpf embryos following in situ hybridization analyses of cmyb gene expression. Lateral view of gene expression in the dorsal aorta region of the trunk is shown with anterior to the left. Compared to DMSO-treated controls (E), embryos treated with 1 μM DEAB (F) or 10 μM AMD3100 (G) exhibit a small reduction cmyb-expressing cell numbers. Embryos treated with both 1 μM DEAB and 10 μM AMD310 (H) exhibit a more severe reduction in cmyb-expressing cell numbers. (I) Graph demonstrating the mean number of dorsal aorta cmyb-expressing cells in DMSO-treated controls, embryos treated with 1 μM DEAB, 10 μM AMD3100, or both 1 μM DEAB and 10 μM AMD310. Error bars represent standard error. *Indicates statistically significant difference compared to control (P ≤ 0.0144). **Indicates statistically significant difference compared to 1 μM DEAB, and 10 μM AMD3100 (P ≤ 0.0028). See text for statistical tests. |