
- Title
-
Methods for the analysis of early oogenesis in zebrafish
- Authors
- Elkouby, Y.M., Mullins, M.C.
- Source
- Full text @ Dev. Biol.

Representative oocytes of early stages and a method to measure oocyte size for staging. (A) Representative early oocytes demonstrating staging criteria from Table 1, including telomere distribution as a marker of meiotic progression. Telomeres (Telo-FISH, red) are distributed in the nucleus of the oogonia, then loaded radially on the NE at the leptotene stage. At the early zygotene stage (left zygotene panel), telomeres are tightly clustered on one side of the NE. This clustering is less tight in the later zygotene stage (right zygotene panel). Telomeres redistribute radially at the pachytene stage and start to unload from the NE. At the diplotene stage telomeres are intranuclear. The general cytoplasm is detected by the DiOC6 lipid dye (green), and chromosomes are stained with DAPI (blue). Note staging criteria, such as oocyte size, DNA condensation, nucleoli (grey dots) number, and nuclear morphology across stages. Scale bars are 5 µm for oogonia-zygotene, and 10 µm for pachytene and diplotene. Modified from Elkouby et al. (2016). (B) A method to measure oocyte size in three dimensions in whole mount ovaries. For convenience, the oocyte shown is stained for cytoplasmic membranes (β-catenin, red), DiOC6 (green) and DAPI (blue). (1) Along the Z axis, find the optical section in which the oocyte appears the largest (Section #10, magenta frame). Scale bar (only shown on Section #10) is 10 µm. (2) In this optical section, measure the length of two perpendicular, or close to perpendicular, lines along the longest diameters of the oocyte (L1, L2). (3) The average of L1 and L2 defines the approximate diameter that indicates the size of the measured oocyte. (4) Determine the oocyte stage in Table 1 that corresponds to the size of the measured oocyte, and determine the stage according to the size and additional staging criteria in Table 1. |
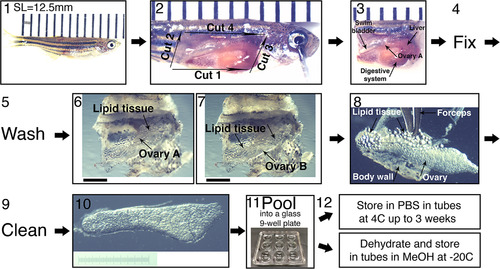
Collection of ovaries from juvenile fish and their fine dissection. (1) SL measurement. A representative 5 wpf fish of SL=12.5 mm is shown. Fish is laid on a ruler; bars are 1 mm apart. The image is stitched from two smaller frames. (2) The four initial dissection cuts from step 4 in the protocol, exposing the fish internal organs. Bars as in (1). (3) The head and tail are removed and the entire trunk piece is fixed. If ovaries are removed from the fish pre-fixation, they curl up. Fixing the entire trunk piece preserves the ovary morphology. The ovary closer to the image plane (ovary A) and other organs are indicated with arrows. Bars as in (1). (4) The trunk piece is fixed overnight and (5), washed 2-3x in 1xPBS, and the ovaries are finely dissected (6−10). (6−7) The swim bladder, liver and digestive system, are removed from the trunk piece, exposing the ovaries and surrounding lipid tissue. (6) is focused on ovary A and (7) on ovary B. Scale bars are 1 mm. (8−9) The ovaries are removed from the fish, and are cleaned from all lipid tissue and body wall remnants (arrows). (10) An example of a clean ovary. Scale bar is 1 mm (graded 10 µm). (11) Ovaries can be pooled in a glass well-plate and (12) stored in the appropriate conditions for the subsequent application. |
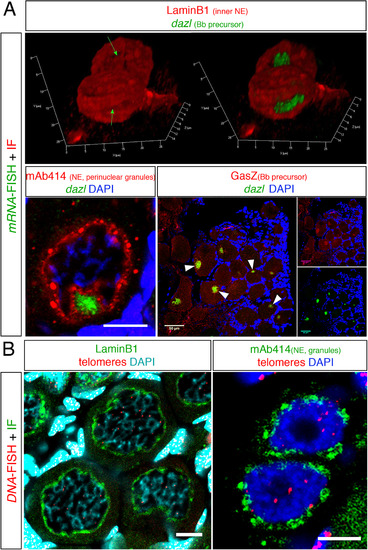
Fig. 3. Examples of staining combinations of IHC and FISH protocols. (A) The combination of dazl mRNA FISH with IHC of various proteins. (top) A snapshot form a 3D movie showing dazl in the nuclear cleft in two pachytene-early diplotene oocytes, as detected with the Lamin B1 protein. In the left image the dazl channel is omitted exposing the nuclear cleft (green arrows). Bottom left, dazl localization in the nuclear cleft as detected with mAb414 in 30–35 µm oocytes. Scale bar=10 µm. Bottom right, colocalization of dazl and the GasZ protein in the Bb (white arrowheads) of oocytes in whole ovary. Scale bar=50 µm. (B) The combination of DNA FISH with IHC of various proteins. Left, DNA FISH detecting telomeres by a probe for telomere repeats sequences (Telo-FISH) combined with IF for LaminB1 in a group of diplotene 30–40 µm oocytes. Note telomere detection at presumptive chromosomal edges, which at this stage should be still connected by chiasmata. Partial projection is shown. Scale bar=10 µm. Right, the distribution of mAb414 positive perinuclear granules in two oogonia where telomeres are found intranuclearly. Scale bar=5 μm. Panels A(left) and A(right) are modified from Elkouby et al. (2016). |

Live time-lapse imaging. Ovaries of fish expressing Lifeact-GFP to label Actin and H2A-GFP to label chromatin via Histone2A [Tg(βact:Lifeact-GFP); Tg(h2afva:h2afva-GFP)] were collected and imaged live. (A) A four-chamber glass bottom dish used for mounting cultured live ovaries for time-lapse imaging. (B) A still image from a time-lapse recording showing several 2–8-cell oogonial cysts. Image is a partial projection not showing all cells in each cyst. White arrowhead indicates chromatin detected by H2A-GFP labeling. Orange arrowhead indicates the cortex of the cell as detected by the Lifeact-GFP. Scale bar is 10 µm. (C) A dividing oogonial cell progressing from metaphase, to anaphase, and cytokinesis Images are partial projections. Time is indicated in minutes (min). Scale bar is 10 µm. White arrowheads indicate the segregating chromosomes (H2A-GFP) from the metaphase plate and into individual daughter cells. The orange arrowhead indicates the cortex of the cell as detected by Lifeact-GFP at time 00:00 min. The magenta arrowhead indicates the appearance of a cleavage furrowin cytokinesis at time 04:36 min, and presumptive membrane between daughter cells at time 06:08 min. Tg(βact:Lifeact-GFP) and Tg(h2afva:h2afva-GFP) were previously reported (Behrndt et al., 2012;Pauls et al., 2001). |
Reprinted from Developmental Biology, 430(2), Elkouby, Y.M., Mullins, M.C., Methods for the analysis of early oogenesis in zebrafish, 310-324, Copyright (2017) with permission from Elsevier. Full text @ Dev. Biol.