
- Title
-
Rapid mapping of visual receptive fields by filtered back projection: application to multi-neuronal electrophysiology and imaging
- Authors
- Johnston, J., Ding, H., Seibel, S.H., Esposti, F., Lagnado, L.
- Source
- Full text @ J. Physiol.
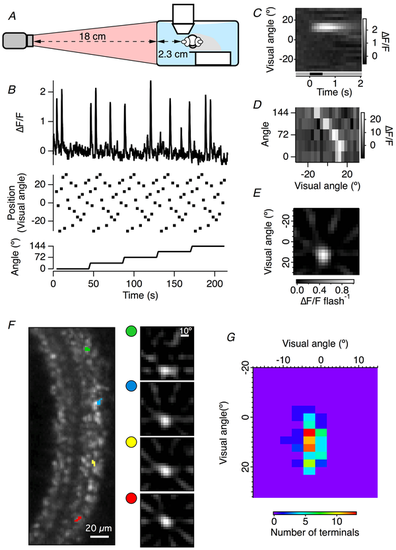
The FBP method is suitable for in vivo calcium imaging of zebrafish bipolar cell terminals. A, diagram of the experimental setup. A zebrafish expressing SyGCaMP6(10.500) in bipolar cells was placed under the two-photon microscope objective, with one eye facing a screen positioned 2.3 cm away. Visual stimuli were presented using a rear projection system with the projector 18 cm away from the screen. B, the response of a single bipolar cell terminal to flashed bars at the positions and angles indicated. C, a peri-stimulus response diagram for a single bipolar terminal to -100% contrast bars flashed for 0.5 s onto different locations of the screen at a single angle. D, the integral of the response for each bar position and each bar angle, equivalent to the Radon transform. E, the RF of the bipolar terminal in B and C recovered using FBP. F, a field of view in the inner plexiform layer containing an array of bipolar synaptic terminals. Example RFs of 4 bipolar terminals are shown on the right. The locations of these terminals in the field of view are indicated by the colour code. Note that bipolar cell terminals situated at one side of the retina have RFs located at different locations from terminals situated at the opposite side. G, a map of the RF centre locations for all bipolar terminals detected in the field of view in F. The centre location was defined as the pixel in the RF with the maximum absolute value. |