- Title
-
Steering cell migration by alternating blebs and actin-rich protrusions
- Authors
- Diz-Muñoz, A., Romanczuk, P., Yu, W., Bergert, M., Ivanovitch, K., Salbreux, G., Heisenberg, C.P., Paluch, E.K.
- Source
- Full text @ BMC Biol.
|
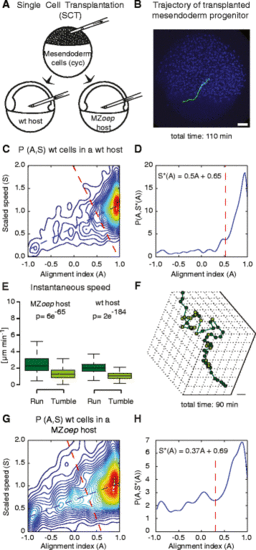
Mesendodermal cells display runs and tumbles during directed migration. a Schematic of the single cell transplantation experiments where mesendoderm progenitor cells are transplanted into a wt or MZoep host. b Lateral view of a host embryo (ectodermal nuclei are labeled with Histone-Alexa 647 in blue) at 60 % epiboly (7hpf) with an example track of a control (green) mesendoderm cell transplanted into the lateral germ ring margin at 50 % epiboly (5.5hpf). Scale bar = 50 μm. c Two-dimensional probability density of the alignment index (A) and scaled speed (S), P(A,S), calculated for mesendodermal cells transplanted into wt hosts (n = 18). The blue dashed line shows the linear fit to the maximum values of P(A,S) for A. The red dashed line is the line, perpendicular to the maximum, defining the threshold above which a portion of a trajectory is considered to be a run phase (also in d). The intersection point is at A = 0.52, corresponding to the local minimum between the global maximum and the nearest local maximum of P(A,S) along the maximum line (displayed in d). d One-dimensional cross-section of P(A,S) along the maximum line, S*(A). e Instantaneous speed of single mesendoderm cells transplanted into wt and MZoep hosts during run and tumble phases. N = 854 runs and 478 tumbles in MZoep hosts (23 cells) and 1317 runs and 484 tumbles in wt hosts (18 cells). Statistical significance by t-test. f Exemplary three-dimensional cell trajectory displaying run (dark green) and tumbling phases (light green). The points represent cell positions over time. Scale bar = 50 μm. g Two-dimensional probability density P(A,S), calculated for mesendodermal cells transplanted into MZoep hosts (N = 23). Lines as in c. The intersection point is at A = 0.3. h Like “d” for probability density in “g” |
|
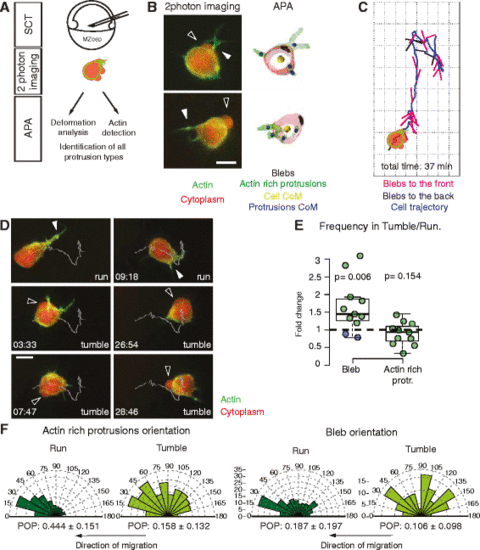
Analysis of protrusion orientation during single mesendoderm cell migration. a Cell migration and protrusion formation analysis procedure, from single mesendoderm cell transplantation to automatic protrusion analyzer (APA). b Left: Control cells displaying blebs (black arrowheads) and actin-rich protrusions (white arrowheads). Right: Corresponding cell outlines after APA processing, where the different protrusion types and the centers of mass (CoM) of cells and protrusions have been labeled. Scale bar = 10 μm. c Exemplary cell trajectory displaying unit vectors pointing from the cell CoM to the blebs CoM. Blebs are classified as forming towards the front if they form in the local direction of cell displacement. d Time lapse of a control mesendoderm cell transplanted in an MZoep host displaying run and tumbles during migration. White line: trajectory of the CoM of the cell; white arrowheads: actin-rich protrusion; black arrowheads: blebs. Scale bar = 10 μm. Time in min:sec. e Frequency ratio of the formation of blebs and actin-rich protrusions during tumble versus run phases. The data points colored in blue correspond to cells where the reorientation events are associated with the formation of a new actin-rich protrusion at the leading edge. Note that the bleb frequency also includes the false negatives not detected by APA (Additional file 4: Figure S2). f Orientation of actin-rich protrusion and bleb formation in run and tumble phases. Arbitrary units (AU) are used for actin-rich protrusions as they are weighted with the total intensity of the Lifeact signal. The arrows below the diagrams indicate the local direction of cell migration. The overall orientation of each protrusion type was quantified using the polar order parameter (POP, see Additional file 1: Supplementary Methods for details). Mean ± SEM. In b and d cells express Lifeact-GFP (green) and Dextran-Alexa 594 (red). Number of cells in (e, f) = 11. Number of blebs in (f) = 349. Statistical significance by one-sided t-test (e) or by non-overlapping SEM of the POP (f) (Additional file 7: Figure S3D) |
|
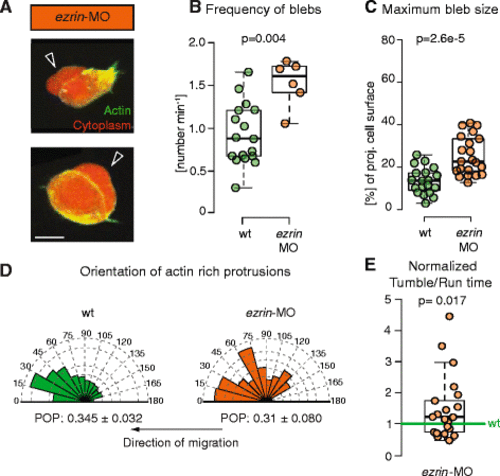
Protrusion formation and orientation in ezrin morphant mesendoderm cells. a Exemplary ezrin-MO-injected mesendoderm cells displaying blebs (black arrowheads). Cells express Lifeact-GFP (green) and Dextran-Alexa 594 (red). Scale bar = 10 μm. b, c Quantification of bleb formation frequency (b) and bleb size at maximal expansion normalized to cell size (c) in control and ezrin-MO-injected mesendoderm cells. Note that bleb frequency also includes the false negatives not detected by APA (Additional file 4: Figure S2). d Orientation of actin-rich protrusion formation in ezrin-MO-injected cells with respect to the local direction of migration. The arrows below the diagrams indicate the direction of migration. The orientation of actin-rich protrusions was weighted by their actin content (i.e., total Lifeact fluorescence) to account for size differences between protrusions, their number is thus given in arbitrary units. POP: mean ± SEM of the magnitude of the polar order parameter. e Ratio of tumbling to run times in migrating single lateral ezrin morphant mesendoderm cells (ezrin-MO). Cells were tracked during the approximately first 2 hours after transplantation. The ratio was normalized to transplanted control cells in the same embryo (internal controls) to account for experimental variability between different embryos. Number of analyzed cells in (b, d) = 17 for control and 6 for ezrin-MO; (e) = 21 for ezrin-MO. Number of blebs in (c) = 19 for control and 21 for ezrin-MO. Statistical significance by Mann–Whitney test (b, c), by non-overlapping SEM of the POP (d) (see also Additional file 7: Figure S3D) or by one-sided t-test (e) |
|
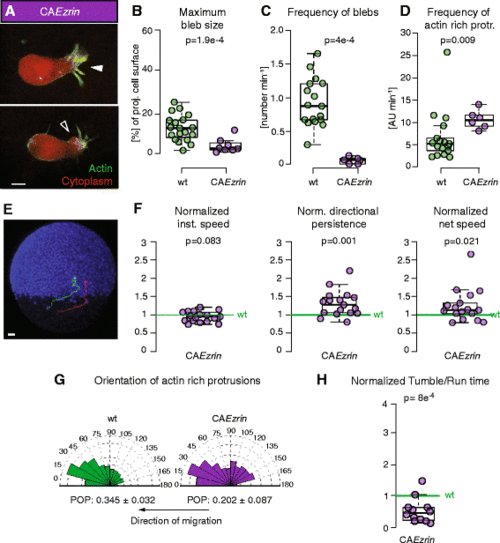
Protrusion formation and migration directionality in mesendoderm cells expressing CAEzrin. a Exemplary actin-rich protrusion (white arrowhead) and bleb (black arrowhead) in CAEzrin-expressing cells. Cells express Lifeact-GFP (green) and Dextran-Alexa 594 (red). Scale bar = 10 μm. b, c Quantification of bleb size at maximum expansion normalized to the cell size (b) and bleb formation frequency (c). Note that bleb frequency also includes the false negatives not detected by APA (Additional file 4: Figure S2). d Quantification of the frequency of formation of actin-rich protrusions. e Lateral view of a MZoep mutant embryo (ectodermal nuclei are labeled with Histone-Alexa 647 in blue) at 60 % epiboly (7hpf) with example tracks of control (green) and CAEzrin-expressing mesendoderm cells (red) transplanted into the lateral germ ring margin at 50 % epiboly (5.5 hpf). Tracking time = 110 min. Scale bar = 50 μm. f Ratio of instantaneous speed, directional persistence, and net speed of transplanted CAEzrin-expressing single lateral mesendoderm cells. g Orientation of actin-rich protrusion formation in control and CAEzrin cells. The arrows below the diagrams indicate the local direction of migration. POP: mean ± SEM. h Ratio of tumbling to run times in migrating single lateral mesendoderm cells expressing CAEzrin. Cells were tracked during the approximately first 2 hours after transplantation. In f and h, values are ratio relative to transplanted control cells in the same embryo (internal controls) to account for experimental variability between different embryos (see also [13]). In d and g, arbitrary units (AU) are used as actin-rich protrusions weighted with the total intensity of the Lifeact signal in the protrusion. Number of blebs (b) = 19 for control and 8 for CAEzrin. Number of cells in c, d, and g = 17 for control and 6 for CAEzrin; (f) = 17 and (h) = 12 CAEzrin compared to control. Statistical significance by Mann–Whitney test (b–d), one-sided t-test (f and h), or by non-overlapping SEM of the POP (g) (Additional file 7: Figure S3D) |


