
- Title
-
Diversity in cell motility reveals the dynamic nature of the formation of zebrafish taste sensory organs
- Authors
- Soulika, M., Kaushik, A., Mathieu, B., Lourenço, R., Komisarczuk, A.Z., Romano, S.A., Jouary, A., Lardennois, A., Tissot, N., Okada, S., Abe, K., Becker, T.S., Kapsimali, M.
- Source
- Full text @ Development
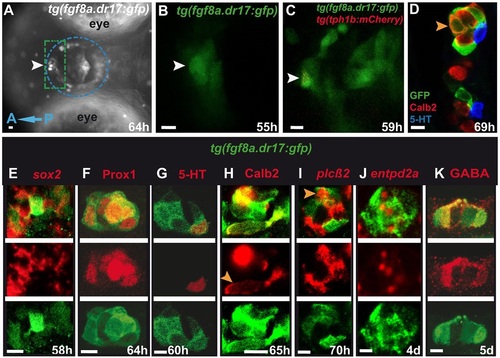
tg(fgf8a.dr17:gfp) expression in developing taste bud cells. In all figures unless otherwise mentioned images are ventral views, anterior to the left. (A) Dissection scope. (B,C) 10µm spinning-disk images, live larvae. In A, mouth epithelium (lips and wall) is within the blue dotted circle. Time-lapse imaging focused on anterior mouth epithelium (green dotted rectangle). White arrowheads indicate anterior-medial mouth where a taste bud forms (A,B) and a cell co-expressing tg(fgf8a.dr17:gfp) and tg(tph1b:mCherry) (C, red dots), respectively. (D-K) 2µm confocal sections. In E-K, each column shows merge, taste bud marker (red) and tg(fgf8a.dr17:gfp) expression (green). In D,H,I, orange arrowheads indicate tg(fgf8a.dr17:gfp) cells that co-express Calb2 /plcb2. Scale bars: 10µm. |
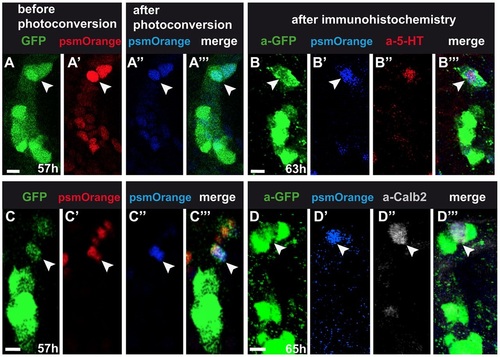
Fate-mapping of tg(fgf8a.dr17:gfp) cells. 4µm confocal projections of anterior mouth. One embryo per row, arrowheads indicate the same cell per row. (A,C) tg(fgf8a.dr17:gfp), (A′,C′) non-photo-converted, (A′′,C′′) photo-converted nuclear PSmOrange expression in forming taste buds. (B,D) tg(fgf8a.dr17:gfp) expression detected with anti-GFP antibody. (B′,D′) Photo-converted nuclear PSmOrange after fixation. (B′′,D′′) Antibody-detected 5-HT or Calb2 expression. Scale bars: 10µm. |
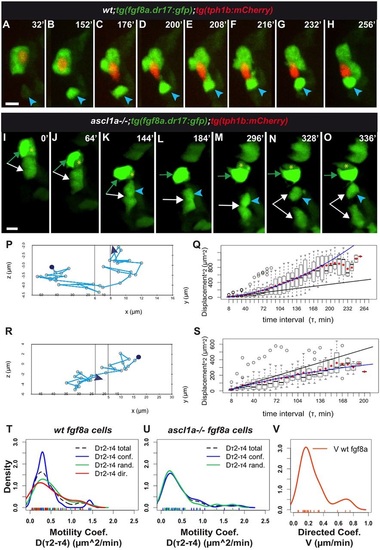
tg(fgf8a.dr17:gfp) cell displacement during taste bud formation: differences between wild-type and ascl1a-/- larvae. In all figures with movie snapshots unless otherwise mentioned: spinning-disk z-stack image projections; time (minutes, top right) counts from time-lapse beginning. Anterior-medial mouth in live larvae. (A-H,I-O) Snapshots from Movies 1 and 7, respectively, started at approximately 60hpf. (A-H) Wild-type. (I-O) ascl1a-/- mouth devoid of tg(tph1b:mCherry) expression. For detailed statistics, see Table 1, Fig. S2A-D, Tables S1,S2. Additional data in Appendix S1. tg(fgf8a.dr17:gfp) (green) cells form taste buds with (A-H) or without (I-O) tg(tph1b:mCherry) (red) expressing cells. In A-H, blue arrowhead indicates an epithelial tg(fgf8a.dr17:gfp) cell that joins the organ. In I-O, the arrows, arrowhead and asterisk indicate cells that initially formed an organ (green arrow- and yellow asterisk-marked cells overlap on z-axis in L). This organ splits over time and cells can remain together or become separate and regroup. (P,R) Tracks of relative displacement while individual cells (blue arrowheads in A-H,K-O, respectively) joined taste buds. Reference cell: in P, the tg(tph1b:mCherry) shown in A-H, time period 0-256min; in R, the tg(fgf8a.dr17:gfp) cell indicated by green arrow in I-O, time period 136-336 min. See additional data in Movie 1, blue dot; Movie 7, red dot; Appendix S1. (Q,S) MSD(τ) plots corresponding to tracks in P,R, respectively. Each boxplot shows all square displacement values for corresponding time intervals (each time interval 8min, τ1=one interval, τ2=two intervals...); mean values shown by red diamonds. Black line is linear fit to τ2-τ4 mean values. Blue line is fit with the minimal summed-square of residuals; quadratic (Eqn. 6) in Q, showing directed motion; asymptotic (Eqn. 5) in S, tending towards a constant value B; confined displacement in a domain of size ~B. See Appendix S1. (T-V) Kernel (probability) density plots of coefficients for tg(fgf8a.dr17:gfp) cell motility. In T,U, motility coefficients Dτ2-τ4 come from similar continuous distributions in wild-type or ascl1a-/- larvae (see also Tables S1,S2, Fig. S2). In U,V, ascl1a-/-;tg(fgf8a.dr17:gfp) cells were devoid of directed motility [absence of ascl1a-/- Dτ2-τ4 and V, in U and V graphs, respectively]. Scale bars: 10µm. |
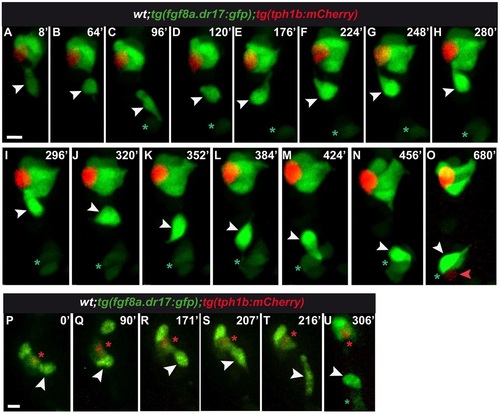
Developing tg(fgf8a.dr17:gfp) cells can be displaced between neighboring forming taste buds. (A-O) Snapshots of Movie 2 with time-lapse started at approximately 65hpf. Top of frame shows developing taste bud composed of tg(fgf8a.dr17:gfp) and tg(tph1b:mCherry) cells. In C-O, bottom of frame, the asterisk marks tg(fgf8a.dr17:gfp) cells forming a taste bud. White arrowheads indicate a single tg(fgf8a.dr17:gfp cell displaced between the two taste buds (A-O); maintained in the upper taste bud (H,I) or joined to the bottom taste bud (M-O). Red arrowhead in O indicates a tg(tph1b:mCherry) cell, obvious after the integration of the displaced tg(fgf8a.dr17:gfp) cell (white arrowhead). Statistics are available in Table 1, Tables S1,S2, Fig. S2A-D, additional data in Appendix S1. (P-U) Snapshots of Movie 3 with time-lapse started at approximately 65hpf. Red asterisk is next to a cell co-expressing tg(fgf8a.dr17:gfp) and tg(tph1b:mCherry). White arrowhead indicates a tg(fgf8a.dr17:gfp) cell maintained within the taste bud for more than 180min (P-S); it quits (T) towards another tg(fgf8a.dr17:gfp) expressing cell (U, green asterisk). Statistics are in Table 1, Tables S1,S2, Fig. S2A-D. Scale bars: 10µm. |
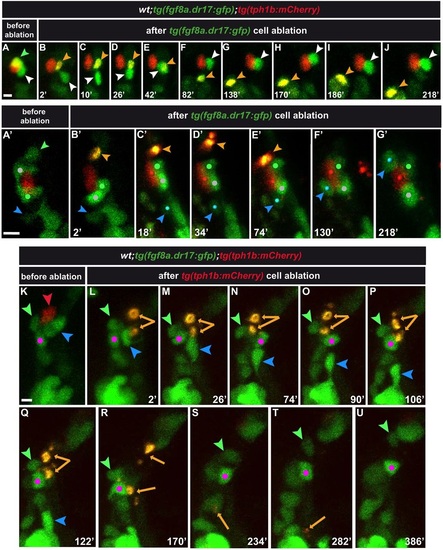
Consequences of tg(fgf8a.dr17:gfp) or tg(tph1b:mCherry) cell ablation in taste bud formation. Anterior-lateral mouth, multi-photon z-stack image projections. The green (A,A2) and red (K) arrowheads indicate tg(fgf8a.dr17:gfp) and tg(tph1b:mCherry) cells that were ablated. (C-J,C′-G′,M-U) Snapshots of Movies 4-6, respectively. Time (min) after multi-photon laser ablation is shown. Statistics are in Fig. S3. Orange arrowheads (B-J,B′-E′) and arrows (L-T) indicate remaining fragments (yellow/orange) of ablated cells. In E, the remaining fragment overlaps with the neighboring tg(fgf8a.dr17:gfp) cell (z-projection). In A-J, white arrowhead indicates the tg(fgf8a.dr17:gfp) cell displaced away from (B-D) but re-established contact with (E-J) the tg(tph1b:mCherry) cell after ablation of the neighboring tg(fgf8a.dr17:gfp) cell. In A′-G′, white and green dots mark the position of intact tg(fgf8a.dr17:gfp) cells that maintained contact with the tg(tph1b:mCherry) cell after ablation of the neighboring tg(fgf8a.dr17:gfp) cell (orange arrowhead). Blue arrowhead/dot marks a tg(fgf8a.dr17:gfp) cell that joined the taste bud. In K-U, the three cells next to the tg(tph1b:mCherry)-ablated cell (orange arrows) are marked. Blue and green arrowheads mark cells that quitted the ablation site towards other taste buds. The pink dot marks a cell that remained in proximity to the ablation site and formed a group with tg(fgf8a.dr17:gfp) (low expression) cells that were not part of the targeted taste bud (see also Movie 6). Scale bars: 10µm. |
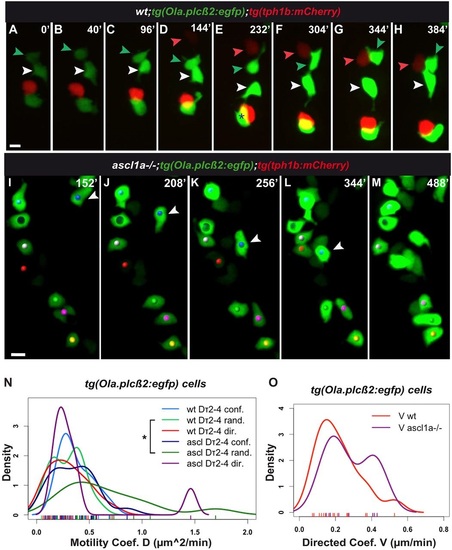
tg(Ola.plcβ2:egfp) cells are displaced in three modes in the wild-type and ascl1a-/- mouth. (A-H,I-M) Snapshots of Movies 9 and 10, respectively. Both films started at approximately 64hpf. Additional data is shown in Table 1, Tables S1, S2, Fig. S2E-H, Appendix S1. (A-H) tg(Ola.plcβ2:egfp) cells formed in proximity to tg(tph1b:mCherry) cells (red, red arrowhead), they were displaced among them (white, green arrowheads) and joined them. In E, asterisk shows overlap of two cells on z-axis. (I-M) ascl1a-/-;tg(Ola.plcβ2:egfp) cells form groups (yellow, pink, green dots at the bottom of the frame). White arrowhead indicates a cell that joined the cell indicated with a red dot in directed mode (Appendix S1). (N-O) Kernel plots of motility Dτ2-τ4 coefficients of tg(Ola.plcβ2:egfp) cells. In contrast to tg(fgf8a.dr17:gfp) cells, tg(Ola.plcβ2:egfp) cells show directed motility in ascl1a-/- mouth (compare with Fig. 3 T-V). The significant difference between wild-type and ascl1a-/- relative random motility Dτ2-τ4 coefficients are highlighted with an asterisk (light and dark green; KS test, *P<0.05). Detailed statistics for all motility coefficients are provided in Tables S1, S2, Fig. S2. Scale bars: 10µm. |
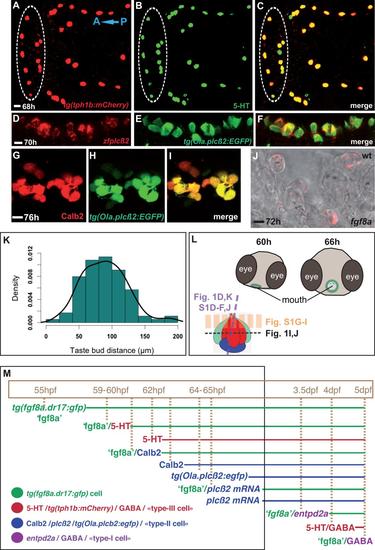
Expression patterns of taste bud markers used in this study. A-C: Expression of tg(tph1b:mCherry) in the developing oropharyngeal 5-HT cells. Anterior to the left. 1µm confocal optic section showing cells co-expressing tg(tph1b:mCherry) and 5-HT in the oropharynx of an embryo processed for immunohistochemistry with anti-mCherry and anti-5-HT antibodies. Within the white dotted-line oval are located the 5-HT cells of the mouth; otherwise, 5-HT cells located on anterior pharyngeal arches. D-I: Expression of zebrafish plcβ2 and Calb2 in taste bud tg(Ola.plcβ2:egfp) expressing cells. Anterior to the top. 5µm confocal optic sections in the mouth area, showing cells co-expressing tg(Ola.plcβ2:egfp) (E,H, green, anti- GFP) and plcβ2 mRNA (D, red, cRNA probe) or Calb2 (G, red, anti-Calb2), in the oropharynx of two zebrafish larvae. J: fgf8a mRNA is expressed in taste bud cells. To validate the tg(fgf8a.dr17:gfp) line as a tool for taste bud development, we checked whether fgf8a mRNA expression persists in developing taste bud cells and not only expressed in the oropharyngeal epithelium as previously shown (Kapsimali et al., 2011). 2µm optic section showing fgf8a mRNA (fast red fluorescent signal) in taste-bud cells detected by transmission light. K: Normal distribution of the distance (µm) between neighbouring taste buds in the wild-type mouth epithelium at 5dpf. Mean value=89µm, sd=34µm, n=87 pairs from 9 larvae. Shapiro-Wilk normality test : W = 0.9809, pvalue = 0.2217. L: Top: Cartoon showing the changing position of the mouth during the developmental period we performed imaging. The mouth is displaced from ventral (shown in the slightly oblique larval head schema at 60hpf) to dorsal and anterior position. The epithelium surrounding the mouth opening is coloured in green and we imaged the anterior part of it. Bottom: Schema of a forming taste bud. The dotted line shows the levels of zoptical sections in Fig.1 and S1. M: Cartoon showing the (co-) expression of taste bud cell markers during developmental timing (hours or days post fertilization) in the zebrafish anterior mouth. This study focused on tools required to observe early differentiating (tg(fgf8a.dr17:gfp) referred also as ‘fgf8a’ for clarity, 5-HT (Type-III), or Type-II (Calb2, plcb2) cells (black-lined rectangle). Markers for the same cell type, are shown in the same colour. The coloured lines indicate expression throughout this developmental time-period. |
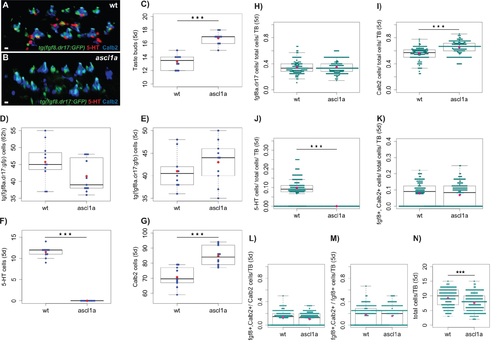
Comparison of taste buds (A-B), their number (C), total number of cells of each type (D-G) and ratios of cells (per cell type and per taste bud, H-M) in wild-type and ascl1a-/- larvae mouth lips. The phenotype of taste buds and general larval morphology is indistinguishable between wild-type and heterozygous ascl1a+/- larvae and therefore, these data were grouped as ‘wild-type’. Data from 10 wild-type (wt: grouped 6 wild-type and 4 wild-type siblings from heterozygous ascl1a+/- crosses, n=133 taste buds) and 10 ascl1a-/- larvae (n=169 taste buds, 5dpf, fixed tissue), except D (n=11, ‘wild-type’= 6 wild-type and 5 wild-type siblings from heterozygous ascl1a+/- crosses, 62hpf, fixed tissue). In the boxplots, black lines show median values and red spots, mean values. A,B confocal projections showing the taste buds of the mouth lips of a wild-type and an ascl1a-/- larva. ascl1a-/- larvae were devoid of 5-HT cells (B,F,J), had non significant difference in the number of tg(fgf8a.dr17:gfp) expressing cells (D,E,H) but had increased number of taste buds (C) and Calb2 (Type II) expressing cells (G,I) compared to the wild-type. K shows the ratio of cells per taste bud that coexpress tg(fgf8a.dr17:gfp) and Calb2. L shows the ratio of Calb2/Type II cells that co-express tg(fgf8a.dr17:gfp) within a taste bud. M shows the ratio of tg(fgf8a.dr17:gfp) cells that co-express Calb2/Type II cells within a taste bud. 5-HT cells co-expressing tg(fgf8a.dr17:gfp) at 5dpf were rare (n=7/115 cells 5-HT cells). N: The number of total cells varies from one developing taste bud to another at 5dpf. A significant difference was found between the distributions of the total number of cells per taste bud between wild-type and ascl1a mouth lips. Statistical tests: C: Welch two-sample t-test : t = -8.2832, df = 17.384, p-value = 1.923e-07. D: Two-sample Kolmogorov- Smirnov : D = 0.4545, p-value = 0.2058. E: Welch two-sample t-test : t = -1.4604, df = 16.982, p-value = 0.1624. F: Welch two-sample t-test : t = 26.8582, df = 9, p-value = 6.655e-10. G: Welch two-sample t-test : t = - 4.8152, df = 17.968, p-value = 0.0001394. H: Two-sample Kolmogorov-Smirnov : D = 0.0799, p-value = 0.7283. I: Two-sample Kolmogorov-Smirnov : D = 0.4844, p-value = 1.332e-15. J: Two-sample Kolmogorov- Smirnov : D = 0.8647, p-value < 2.2e-16. K: Two-sample Kolmogorov-Smirnov : D = 0.1216, p-value = 0.2211. L: Two-sample Kolmogorov-Smirnov : D = 0.1282, p-value = 0.1732. M: Two-sample Kolmogorov-Smirnov : D = 0.1098, p-value = 0.3313 N: Two-sample Kolmogorov-Smirnov : D = 0.2529, p-value = 0.0001469. |