
- Title
-
Biological outcome and mapping of total factor cascades in response to HIF induction during regenerative angiogenesis
- Authors
- Khatib, A.M., Lahlil, R., Hagedorn, M., Delomenie, C., Christophe, O., Denis, C., Siegfried, G.
- Source
- Full text @ Oncotarget

ZFIN is incorporating published figure images and captions as part of an ongoing project. Figures from some publications have not yet been curated, or are not available for display because of copyright restrictions. |
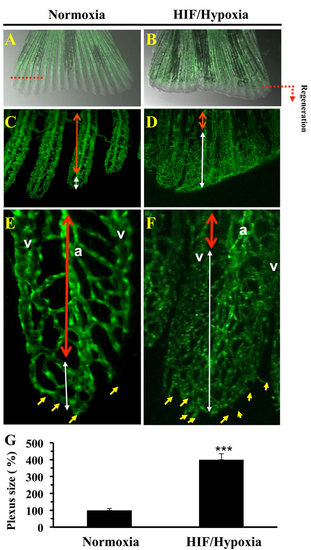
Vasculature plexus formation and remodeling during regenerative angiogenesis and HIF induction. Vasculature of regenerated transgenic zebrafish Tg (fli1: EGFP) caudal fin under normoxic control conditions A. and following exposure to CoCl2 (1mM) B. In controls, by 3-6 dpa, the plexus is remodeled into distinguishable arteries (a) and veins (v) in the proximal regenerate (region delineated by red doubled-headed arrows) C., E. A vasculature plexus is still present at distal end (region delineated by white doubled-headed arrows). E, F), Higher magnification of regenerated fins. D., F. Following CoCl2 (1mM) exposure regenerates failed to complete plexus remodeling adequately. No clear distinguishable arteries and veins in the proximal area of the regenerate are observed (region delineated by blue doubled-headed arrows). Distal ends of regenerates treated with CoCl2 indicated increased sprouts number (yellow arrows) formed at the distal end of the growing vessel. G. Results of plexus length measurement are shown in the bar graph and are expressed as the percentage of length of none clear distinguishable arteries and veins structure relative to those observed under normoxia, which was assigned a value of 100%. Original magnification: 2-x objectives for A-B, 10-x objective for C-D, and 40-x objective for E-F. The amputation plane is indicated. Data shown represents Mean ± S.E (n =15 per group) from three independent experiments. *** P <0.0001. |
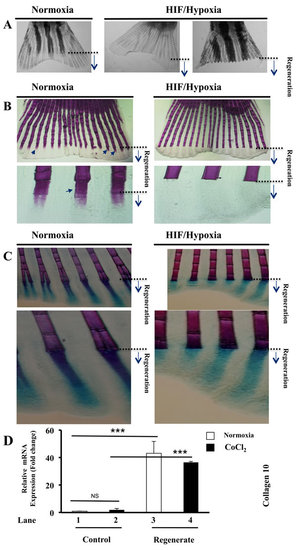
Maintained hypertrophic cartilage formation and inhibition of bone formation during HIF induction. A. Fish exposed to CoCl2 after fin amputation; for 5-6 days, regenerated very fragile fins that fissure easily, leading to their partial or total loss, while they progress in water. B. Alizarin red-staining of fins exposed or not to CoCl2, shows staining of fin rays, including newly regenerated areas (black arrows). Fish exposure to CoCl2 induced loss of Alizarin red staining in regenerated fin areas. Note the inhibition of bone ossification behind the site of amputation in the presence of CoCl2. Original magnifications: 2-x objective for A, 10-x and 40-x objectives for B. C. Double staining of bone (Alizarin red) and cartilage (Alcian-blue) in regenerated fins exposed or not to CoCl2. Note that while exposure to CoCl2, induced loss of Alizarin red staining in the regenerated fin area, Alcian-blue staining pattern was well maintained throughout regenerated fin area. Original magnifications: 10-x and 40-x objective, respectively. D. Fold change in the expression of the hypertrophic marker collagen 10, as measured by real time PCR analysis of total RNA obtained from control and regenerated fins, exposed or not to CoCl2 (1mM). Note the highly induced expression of collagen 10 during regeneration (lanes 1 and 3) and its maintained high expression during hypoxia (lanes 2 and 4). Data shown represents Mean ± S.E (n=6 per group) from three independent experiments. ***P<0.0001. |
|
ZFIN is incorporating published figure images and captions as part of an ongoing project. Figures from some publications have not yet been curated, or are not available for display because of copyright restrictions. PHENOTYPE:
|