
- Title
-
Comparative transcriptome profiling of the injured zebrafish and mouse hearts identifies miRNA-dependent repair pathways
- Authors
- Crippa, S., Nemir, M., Ounzain, S., Ibberson, M., Berthonneche, C., Sarre, A., Boisset, G., Maison, D., Harshman, K., Xenarios, I., Diviani, D., Schorderet, D., Pedrazzini, T.
- Source
- Full text @ Cardiovasc. Res.
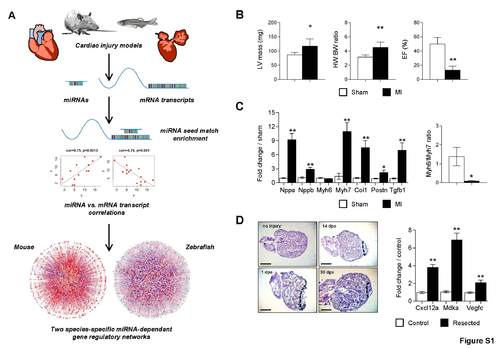
Mouse and zebrafish models of cardiac injury used to perform an integrated bioinformatic analysis for identifying novel miRNA-dependent subnetworks. A) Schematic representation of the strategy. Mouse hearts were subjected to myocardial infarction and zebrafish hearts to apex resection. miRNAs and mRNA transcripts were identified in the mouse and zebrafish hearts 2 weeks after injury. Differentially expressed miRNAs and mRNA transcripts in each species were analyzed to identify positively and negatively correlated miRNA-mRNA pairs, and integrated into two global species-specific regulatory networks. Mouse and zebrafish regulatory networks were directly compared to identify differentially utilized orthologous miRNAs and associated pathways during the response of the heart to injury. B) Characterization of the injured mouse hearts. Left ventricular mass (mg) as determined by echocardiography (left panel), and heart weight to body weight ratio (middle panel) in sham-operated mice and mice with myocardial infarction and ejection fraction (EF) in sham-operated mice and mice with myocardial infarction (right panel). C) Expression of cardiac remodeling-associated genes (Nppa; Nppb; Myh6; Myh7; Col1a1; Postn; Tgfb1) in sham-operated and infarcted mouse hearts (left panel) and Myh6 to Myh7 expression ratio (right panel). Data are expressed as mean ± SEM; n ≥ 6 for each group; * p < 0.05, ** p < 0.01. D) Characterization of the injured zebrafish hearts. HE staining of control and resected zebrafish hearts at 1, 14 and 30 days post-amputation (dpa; left panel) and expression of regenerationassociated genes (Cxcl12a; Mdka; Vegfc) in control and in resected zebrafish hearts (right panel). Data are expressed as mean ± SEM, n ≥ 4, * p < 0.05, ** p < 0.01. |