
- Title
-
UHRF1 regulation of Dnmt1 is required for pre-gastrula zebrafish development
- Authors
- Kent, B., Magnani, E., Walsh, M.J., Sadler, K.C.
- Source
- Full text @ Dev. Biol.
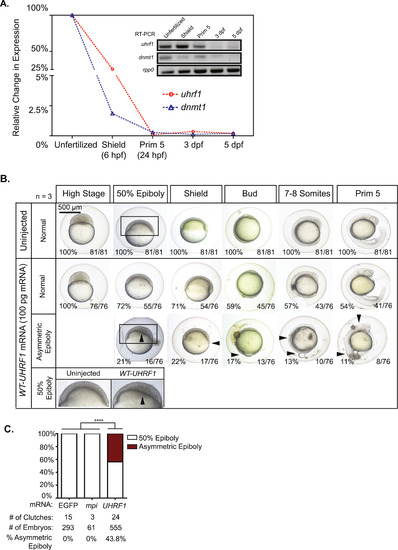
Distinct gastrulation defects in UHRF1 overexpressing embryos during early zebrafish embryogenesis. (A) Endogenous uhrf1 and dnmt1 are maternally provided. RT-qPC and RT-PCR (inset, gel electrophoresis) display the relative transcript levels of uhrf1 in unfertilized eggs, shield stage embryos (6 hpf), prim-5 stage embryos (24 hpf), 3 dpf larvae, and 5 dpf larvae. (B) Progression of embryonic development in uninjected wild-type embryos and UHRF1 overexpressing embryos at each indicated stage. At high stage (3.3 hpf) all embryos appear normal and at 50% epiboly (~5.25 hpf) and shield stage (6.0 hpf), arrows indicate asymmetric epiboly and delay in dorsal organizer formation. At bud stage (10.0 hpf), arrows indicate failure to complete epiboly and premature development of emerging tail bud and at 7-8-Somites stage (~12.0 hpf) arrows depict a delay in somite formation, pinched off yolk and, in some cases, a lack of a developing tail. At Prim-5 stage (24.0 hpf) arrows indicate morphological defects such as under-developed eyes and head, and defects in tail extension. Scale bar=500 µm. (C) The percent of embryos displaying asymmetric epiboly at 6 hpf in those injected with control RNA (EGFP and mpi) and WT-UHRF1. Significance of the percentage of the asymmetric epiboly was determined by Fisher′s exact test. Asterisks (*) indicate p<0.0001. The number of embryos and number of clutches for each condition is indicated. |

Overexpression of phosphorylation-deficient mutant UHRF1 (UHRF1S661A) phenocopies UHRF1 overexpressing embryos eliciting dramatic gastrulation defects. (A) Progression of embryonic development in uninjected and embryos injected with 100 pg of UHRF1S661A mRNA. At 50% epiboly (5.25 hpf), arrows indicate asymmetric epiboly. At Shield stage (6.0 hpf) arrows point to the missing shield and cells that did not undergo proper epiboly cell movements. At bud stage (10.0 hpf) arrows indicate failure to complete epiboly and premature development of tail bud. At 7-8-Somite stage (~12.0 hpf) arrows indicate disrupted anterior-posterior axis, somite formation, and irregular tail formation. At Prim-5 stage (24.0 hpf) arrows indicate defects in head and tail. Scale bar=500 µm. (B) Curve displays the percent of embryos injected with 100 pg of WT-UHRF1 or UHRF1S661A or uninjected controls that were scored as normal; the stages set by the progression of uninjected control embryos (top) and hpf (bottom). Significance was determined by Log-rank Test (p<0.0001). (C) Distribution of phenotypes of embryos injected with 25, 50 and 100 pg of WT-UHRF1 and UHRF1S661A mRNA. Penetrance of the asymmetric epiboly phenotype is statistically significant compared to uninjected controls at each indicated concentration by Fisher′s exact test. Asterisks (*) indicate p<0.001. n.s.=not significant. Number of biological replicates (clutches), number of embryos per treatment, and percent of embryos displaying the asymmetric epiboly phenotype are indicated. (D) Western blot using the Myc tag to detect UHRF1 in WT-UHRF1 and UHRF1S661A overexpressing embryos. Mean levels of Myc-UHRF1 protein per treatment are quantified relative to tubulin and were determined to be equivalent by Student’s t-test (p=0.36). n.s.=not significant. |

uhrf1 knockdown does not phenocopy UHRF1 overexpression. (A) Developmental progression of uninjected embryos and uhrf1 morphants (MO2-5′-UTR) at each indicated stage. At high stage (~3.3 hpf) both uninjected embryos and uhrf1 morphants appear normal and at 50% Epiboly (~5.25 hpf), arrow indicates arrest of uhrf1 morphants that have progressed to yolk extrusion. At shield stage (~6.0 hpf), arrow indicates significant developmental delay in uhrf1 morphants that did not arrest at high stage. Morphants that did arrest at high stage are dead by the time uninjected embryos have reached shield stage. At bud stage (~10.0 hpf), arrow indicates tail bud formation prior to the completion of epiboly in uhrf1 morphants. At 7-8 Somite stage (~12.0 hpf), arrows indicate disrupted CNS, somites and tail bud. At Prim 5 stage (~24.0 hpf), arrows indicate that all surviving uhrf1 morphants display CNS and tail defects. Scale bar=500 µm. (B) Embryos were scored at 6 hpf for asymmetric epiboly, high stage arrest or delay. The depletion of endogenous Uhrf1 by injection of 13 ng 5′UTR uhrf1 morpholino does not affect the asymmetric epiboly phenotype caused by injection of 100 pg of WT-UHRF1 or UHRF1S661A mRNA. The co-injection of WT-UHRF1 or UHRF1S661A mRNA additively increases the percentage of the embryos affected by the asymmetric epiboly phenotype. The treatments, the number of biological replicates, number of embryos and the proportion of embryos displaying the asymmetric epiboly phenotype are indicated. |

dnmt1 knockdown does not phenocopy uhrf1 morphants or UHRF1 over-expressing embryos. (A) Developmental progression of uninjected embryos and those injected with 0.43 ng of dnmt1 morpholino at each indicated stage. Scale bar=500 µm. (B) Quantification of developmental delay at 6 hpf in embryos injected with 0.43, 0.85, 1.28 and 1.7 ng of dnmt1 morpholino and uninjected control embryos. Fisher′s exact test was used to determine statistical significance. n.s.=not significant. (C) Representative western blot and quantification of Dnmt1 protein knockdown at indicated amount of dnmt1 morpholino. Student′s t-test was used to calculate the indicated p-values compared dnmt1 morpholino injected embryos to uninjected controls. Values are average of 3 biological replicates, error bars are standard deviation. |

Dnmt1 overexpression phenocopies the asymmetric epiboly phenotype of UHRF1 and UHRF1S661A overexpressing embryos. (A) Developmental progression of uninjected and WT-dnmt1 overexpressing embryos at indicated stages. At High Stage (~3.3 hpf) all embryos appear normal, at 50% epiboly (~5.25 hpf) and Shield stage (6.0 hpf) arrows indicate asymmetric epiboly and lack of dorsal organizer. At Bud stage (10.0 hpf) arrow points to the front of the migrating cells indicating delayed completion of epiboly. At Prim-5 stage (24.0 hpf) arrows indicate severe defects in head and tail with lack of head and tail extension. (B) Embryos were scored at 6 hpf for asymmetric epiboly and delay following injection of 1, 10, 12.5, 25, 50 or 100 pg of WT-dnmt1 mRNA (sense) or 25, 50, or 100 antisense dnmt1 RNA as a negative control. The number of clutches, total number of embryos scored and percent of asymmetric epiboly are indicated. (C) Overexpression of catalytically inactive dnmt1C1109S (MT-dnmt1) causes asymmetric epiboly. Asterisk indicates statistical significance (p<0.05) using Fisher′s exact test. The number of embryos and biological replicates are indicated. n.s.=not significant. |

Asymmetric epiboly is specific to UHRF1 overexpression. (A) Progression of embryonic development in uninjected and embryos injected with 100 pg of mRNA encoding EGFP. Effective EGFP mRNA translation was determined by fluorescence. EGFP overexpression does not elicit developmental abnormalities. Scale bar = 500 micrometers. (B) Embryos injected with 100 pg mRNA encoding zebrafish WT-Uhrf1 and Uhrf1S648A develop asymmetric epiboly with a similar incidence as those injected with the human homologs. (C) Kaplan-Meier survival curve of WT-UHRF1 overexpressing embryos. Significance was determined by the Log-rank Test (p < 0.0001). (D) Graph of 24 biological replicates of WT-UHRF1 mRNA injected embryos scored at 6 hpf plotted with the total number of embryos per clutch per treatment with indicated phenotype distribution. |

5-AZA treatment does not phenocopy uhrf1 morphants or UHRF1 over-expressing embryos. Embryos were exposed to 70 µM or 100 µM 5- AZA from 0.5 to 6 hpf. (A) Developmental progression of uninjected wild-type embryos and embryos exposed to 70 µM 5-AZA. Scale bar = 500 micrometers. (B) Quantification of sphere stage arrest with the number of embryos, the number of biological replicates, and proportion of embryos displaying sphere stage arrest are indicated. Statistical significance was calculated using Fisher’s exact test (p < 0.05). Asterisk indicates significance. (C) Kaplan-Meier survival curve. |
Reprinted from Developmental Biology, 412(1), Kent, B., Magnani, E., Walsh, M.J., Sadler, K.C., UHRF1 regulation of Dnmt1 is required for pre-gastrula zebrafish development, 99-113, Copyright (2016) with permission from Elsevier. Full text @ Dev. Biol.