
- Title
-
Histopathological analysis of the olfactory epithelium of zebrafish (Danio rerio) exposed to sublethal doses of urea
- Authors
- Bettini, S., Lazzari, M., Ferrando, S., Gallus, L., Franceschini, V.
- Source
- Full text @ J. Anat.
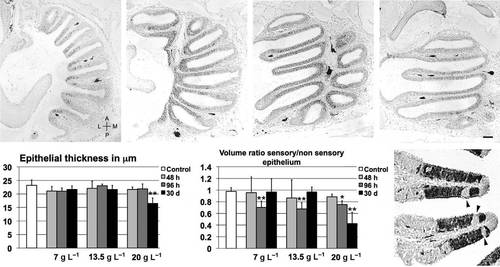
Morphological analysis of olfactory epithelium before and after treatment. (A) Semi-serial horizontal Hu-positive sections (separated by 100 µm) of untreated olfactory rosette at progressively more ventral planes. A, anterior; L, lateral; M, medial; P, posterior; scale bar: 50 µm. (B) Variations in epithelial thickness across treatments. (C) Comparison between volumes of sensory and non-sensory regions in olfactory mucosa; significant differences are indicated by asterisks: *P < 0.05; **P < 0.01. (D) Calretinin-positive lamellae in zebrafish treated with 7 g L-1 for 96 h; arrowheads: non-sensory areas inserted in sensory epithelium; scale bar: 20 µm. |
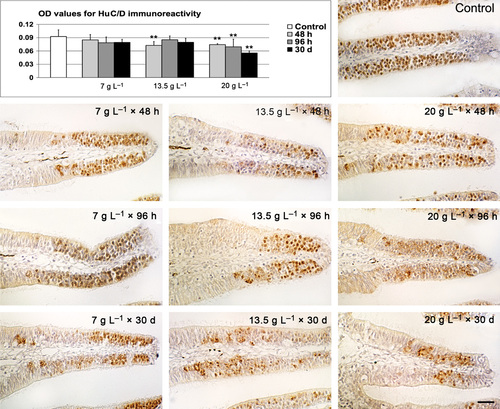
HuC/D immunohistochemistry. (A) Densitometric analysis and comparison between controls and treatments. (B) Representative micrograph of control tissue. (C1–3) Representative micrographs of lamellae exposed to 7 g L-1 of urea. (D1–3) Representative micrographs of lamellae exposed to 13.5 g L-1 of urea. (E1–3) Representative micrographs of lamellae exposed to 20 g L-1 of urea. Significant differences compared with controls are indicated by asterisks: **P < 0.01. Scale bar: 20 µm. OD, optical density. |
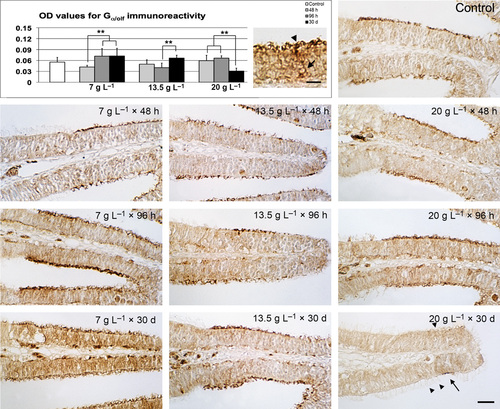
Gα olf immunohistochemistry. (A) Densitometric analysis and comparison between controls and treatments. (B) Detail of control epithelium at high magnification; arrow: labelled cell body in the basal layer; arrowhead: Gα olf-positive olfactory knob. Scale bar: 10 µm. (C) Representative micrograph of control tissue. (D1–3) Representative micrographs of lamellae exposed to 7 g L-1 of urea. (E1–3) Representative micrographs of lamellae exposed to 13.5 g L-1 of urea. (F1–3) Representative micrographs of lamellae exposed to 20 g L-1 of urea. Arrowheads: ciliated non-sensory cells; arrow: Gα olf-positive cells. Significant differences are indicated by asterisks: **P < 0.01. Scale bar: 20 µm. OD, optical density. |
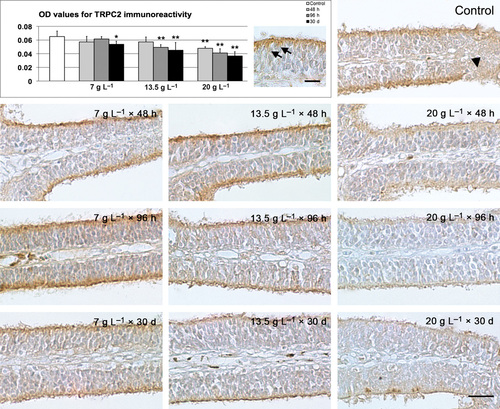
TRPC2 immunohistochemistry. (A) Densitometric analysis and comparison between controls and treatments. (B) Detail of control epithelium at high magnification; arrows: labelled dendrites. Scale bar: 10 µm. (C) Representative micrograph of control tissue; arrowhead: non-sensory epithelium. (D1–3) Representative micrographs of lamellae exposed to 7 g L-1 of urea. (E1–3) Representative micrographs of lamellae exposed to 13.5 g L-1 of urea. (F1–3) Representative micrographs of lamellae exposed to 20 g L-1 of urea. Significant differences compared with controls are indicated by asterisks: *P < 0.05; **P < 0.01. Scale bar: 20 µm. OD, optical density. |
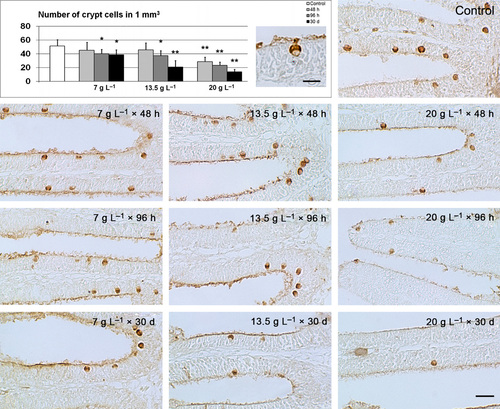
TrkA immunohistochemistry. (A) Density of crypt cells and comparison between controls and treatments. (B) Detail of control epithelium at high magnification; arrowheads: TrkA-positive crypt cells in the apical layer. Scale bar: 10 µm. (C) Representative micrograph of control tissue. (D1–3) Representative micrographs of lamellae exposed to 7 g L-1 of urea. (E1–3) Representative micrographs of lamellae exposed to 13.5 g L-1 of urea. (F1–3) Representative micrographs of lamellae exposed to 20 g L-1 of urea. Significant differences compared with controls are indicated by asterisks: *P < 0.05; **P < 0.01. Scale bar: 20 µm. |

PCNA immunohistochemistry. (A) Density of dividing cells and comparison between controls and treatments. (B) Representative micrograph of control tissue. (C1–3) Representative micrographs of lamellae exposed to 7 g L-1 of urea. (D1–3) Representative micrographs of lamellae exposed to 13.5 g L-1 of urea. (E1–3) Representative micrographs of lamellae exposed to 20 g L-1 of urea. NS, non sensory epithelium; S, sensory epithelium. Scale bar: 20 µm. |