
- Title
-
Hyperspectral Microscopy of Near-Infrared Fluorescence Enables 17-Chirality Carbon Nanotube Imaging
- Authors
- Roxbury, D., Jena, P.V., Williams, R.M., Enyedi, B., Niethammer, P., Marcet, S., Verhaegen, M., Blais-Ouellette, S., Heller, D.A.
- Source
- Full text @ Sci. Rep.
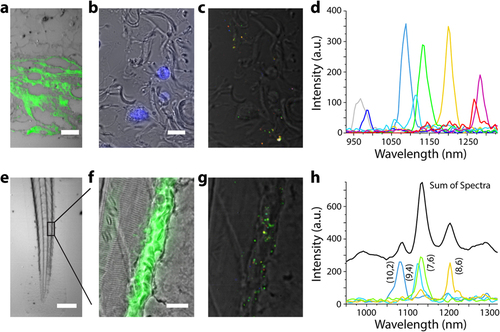
Hyperspectral microscopy of carbon nanotubes ex vivo and in vivo. (a) A vertical cross section of formalin-fixed and paraffin-embedded dermal tissue harvested from a mouse after subcutaneous injection of carbon nanotubes. Scale bar, 50 µm. (b) Horizontal cross section of tissue stained with DAPI (blue). Scale bar, 10 µm. (c) Spectrally-resolved nIR emission merged with a transmitted light image in horizontal cross section. (d) Spectra of 8 individual species of nanotubes present in the imaging field. (e) Transmitted light image of an anesthetized zebrafish injected with nanotubes via the common cardinal vein. Scale bar, 200 µm. (f) Magnified transmitted light image of zebrafish tail fin and FITC-500 kDa-dextran fluorescence (green), delineating blood vessels. Scale bar, 20 µm. (g) Spectrally-resolved nIR emission overlaid with a transmitted light image of the same region. (h) Representative spectra of 4 individual nanotube species found in the zebrafish caudal vein. The majority of bright regions contained multiple co-localized nanotubes (black curve). Since the (7,6) nanotube species was the dominant peak in these aggregates, a high prevalence of green is found in the color-coded nIR emission image. |