
- Title
-
Assessing social engagement in heterogeneous groups of zebrafish: a new paradigm for autism-like behavioral responses
- Authors
- Maaswinkel, H., Zhu, L., and Weng, W.
- Source
- Full text @ PLoS One
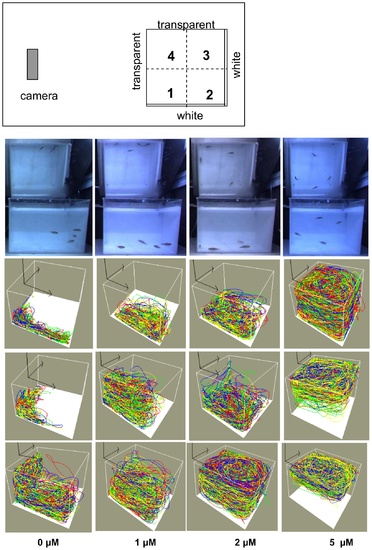
Layout of apparatus. Sample frames and trajectories for the homogeneous shoals in experiment 1. The top panel represents the layout of the observation chamber and the positioning of the observation container. The locations of the quadrants, the transparent and white walls are also indicated. One typical sample frame and three representative trajectories are shown for every concentration of MK-801 for the homogeneous shoals. Column 1:0 μM, column 2:1 μM, column 3:2 μM, column 4:5 μM. Note that the sample frames show the front and (on the mirror) the top view. The different colors represent different zebrafish. Note however, that tag-swapping between zebrafish occurs. The origin of the three arrows is located to the left of the camera (for orientation). Note that with increasing drug concentration, the distance between the fish increases and the horizontal distribution becomes more homogeneous. At the highest concentration (5 μM) the fish swim on average closer to the water surface. |
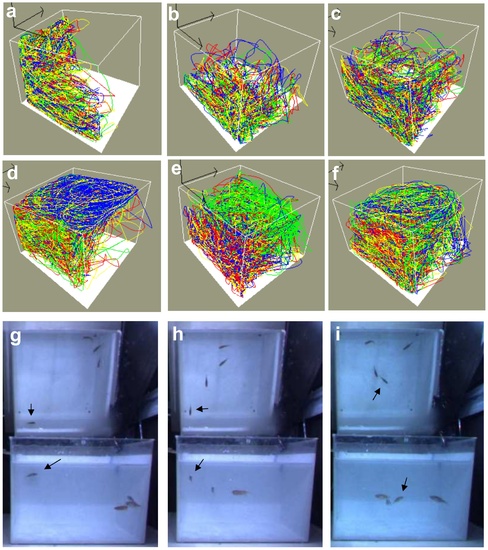
Example trajectories and frames for the heterogeneous shoals in experiment 2. The top row (a–c) shows trajectories of three control quadruplets and the second row (d–f) shows trajectories of three quadruplets consisting of three control zebrafish and one zebrafish treated with 5 μM MK-801. In panel (d) the trajectory of the zebrafish treated with MK-801 is presented in blue, in panels (e) and (f) they are presented in green. (g) The MK-801 zebrafish often swims far apart from the three control zebrafish. (h) The control zebrafish are frequently seen to follow the MK-801 zebrafish, (i) which often leads to increased distances between the three control zebrafish. The black arrows points to the MK-801 zebrafish. |