
- Title
-
The ventral habenulae of zebrafish develop in prosomere 2 dependent on Tcf7l2 function
- Authors
- Beretta, C.A., Dross, N., Bankhead, P., and Carl, M.
- Source
- Full text @ Neural Dev.
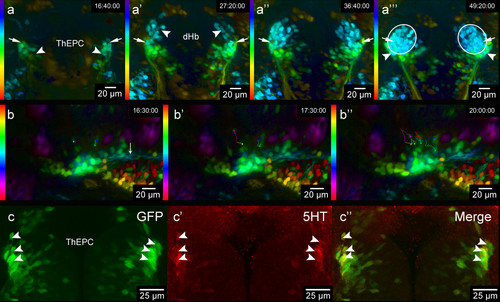
A subpopulation of thalamic-epithalamic early projecting cluster (ThEPC) cells may contribute to the habenulae. (a-a”’) Color code MIP, dorsal views with anterior to the top of the habenula area in living Et(1.0otpa:mmGFP)hd1 embryos at 46 hpf, 57 hpf, 68 hpf and 79 hpf (left to right; see Additional file 1: Movie S1). LUT (look up table) shows the z color code with a z-depth value of 300 μm. Arrows indicate the most anterior ThEPC cells, which appear to end up in the lateral part of the habenulae. (a) Arrowheads indicate the left and right ThEPCs. (a′) Arrowheads indicate the left and the right dHb domain. (a′′′) Arrowheads highlight ThEPC cells, which remain outside the habenulae (circles). (b-b′′) Spectrum MIP, dorsal views with anterior to the left of left-sided ThEPC cells at 48 hpf, 49 hpf and 52 hpf (see Additional file 2: Movie S2). LUT (look up table) shows the z spectrum with a z-depth value of 200 μm. Dots and lines indicate examples of manually tracked dividing cells. (b) Arrow indicates ThEPC axons. (c-c′′) Dorsal view of the thalamic area, MIP, anterior to the top, of a 48 hpf Et(1.0otpa:mmGFP)hd1 embryo stained for 5HT. From left to right: GFP, red and merged channels. Arrowheads highlight some co-labeled GFP/5HT positive neurons. The gamma was adjusted to a value of 0.80 (b,c). dHb, dorsal habenula; ThEPC, thalamic-epithalamic early projection cluster; MIP, maximum intensity projection. |
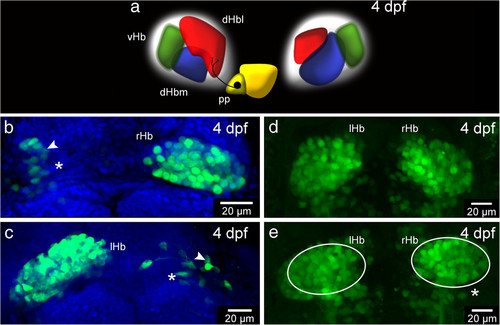
Ablation experiments suggest a contribution of thalamic-epithalamic early projecting cluster (ThEPC) cells to the habenulae. (a) Habenular nuclei at 4 dpf. dHbl, lateral dorsal habenula (red); dHbm, medial dorsal habenula (blue); vHb, ventral habenula (green); P, pineal (yellow); pp, parapineal (dark yellow). (b-e) MIP, anterior to the top, dorsal views of the habenular nuclei of 4 dpf Et(-1.0otpa:mmGFP)hd1 embryos, after (b) left and (c) right dHb ablation at 2 dpf. Asterisks mark the ablated side and white arrowheads highlight neurons located in the lateral habenular domain. The nuclei (in blue) are labeled with Sytox Orange. (d,e) Habenula formation at 4 dpf in (d) not ablated and in (e) ThEPC ablated Et(1.0otpa:mmGFP)hd1 embryos. Asterisk marks the ablated side. Same sized ellipses highlight the habenula size differences. The gamma was adjusted to a value of 0.80. lHb, left habenula; rHb, right habenula; ThEPC, thalamic-epithalamic early projecting cluster. |
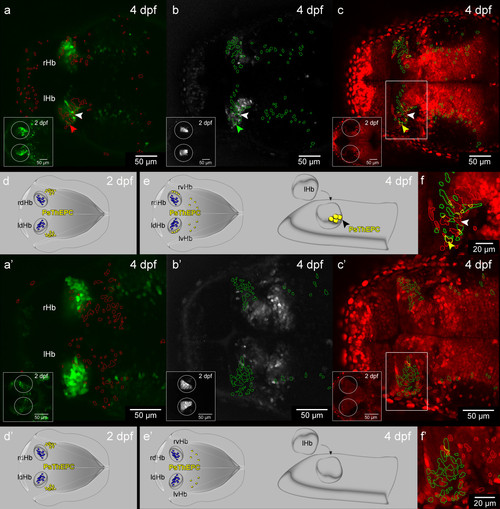
A population of thalamic cells forms the ventral habenula (vHb) in the presence of Tcf7l2 function. (a-c′) Dorsal views, anterior to the left, of a slice from a stack showing 4 dpf (a-c)Et(1.0otpa:mmGFP)hd1 and (a′-c′)tcf7l2exl/exl x Et(1.0otpa:mmGFP)hd1 embryos after photoconversion of H2B-PSmOrange positive cells in the thalamus at 2 dpf (insets). Circles highlight the area of photoconversion. All targeted cells express the photoconverted protein and are in the centre of the circles. The gamma was adjusted to a value between 0.60 and 0.90. (a-a′) Red ROIs show the position of the photoconverted cells in the green channel. (b-b′) Green ROIs show the location of GFP positive cells in the far-red channel. (c-c′) Red and green ROIs were combined in the red channel to visualize the position of GFP photoconverted ThEPC neurons in the habenular nuclei in yellow. Box indicates the region shown in f and f′ with higher magnification for clarity. (a-c,f) Colored arrowheads mark a photoconverted ThEPC derived GFP positive cell in the habenula. White arrowheads mark a photoconverted GFP negative cell in the habenula. (a′-c′,f′) Photoconverted cells are not found in the habenulae of tcf7l2exl/exl mutants. (d-e′) Model showing the contribution of some ThEPC cells (yellow) to the vHb in wild type embryos but not in tcf7l2exl/exl mutants. dHb cells are marked in blue. lHb, left habenula; lvHb, left ventral habenula; Ps, photoconverted; rHb, right habenula; rvHb, right ventral habenula; ROI, region of interest; ThEPC, thalamic-epithalamic early projecting cluster. |
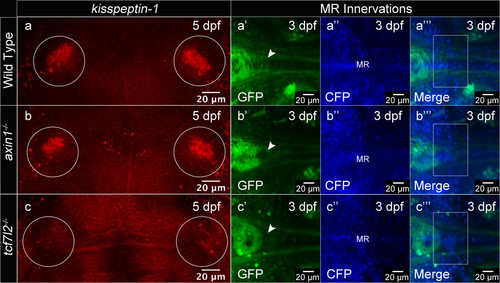
Tcf7l2 function is required for ventral habenula (vHb) development. (a-c) Dorsal views, anterior to the top. kisspeptin-1 expression in the vHb (circle) is not affected by the upregulation of Wnt/beta-catenin signaling in (b)axin1 mutant embryos, but absent in (c)tcf7l2exl/exl mutants. (a′-c′′′) MIPs, anterior to the left, dorsal views of axons innervating the MR in Et(1.0otpa:mmGFP)hd1 transgenic embryos. H2A-CFP labels the cell nuclei. (b′-b′′′) Upregulation of Wnt signaling in axin1 mutants does not affect MR innervation by vHb efferent axons. (c′-c′′′) In tcf7l2exl/exl mutants, the MR are not innervated. White arrowheads and white boxes highlight the location of MR innervating axons, absent in (c′-c′′′). The gamma was adjusted to values between 0.70 and 0.80. vHb, ventral habenula; MR, median raphe. |

Ablation of dHb cells at 53 hpf, related to Figure 2. (a-b′) Dorsal view, anterior to the left, MIP of Et(-1.0otpa:mmGFP)hd1 transgenic embryos before and after complete dHb cell ablation. (a-a′) White arrowheads mark the bilateral dHb nuclei before dHb ablation. Red arrowheads highlight the position of ThEPC neurons. Inset shows a spectrum LUT with a z-depth of 350 μm to highlight that dHb and ThEPC cells can be distinguished because of their different positioning along the D-V and A-P axis. Gamma was adjusted to 0.65. (b-b′) Asterisks mark the site of ablation, white arrowheads mark non-ablated dHb cells and the red arrowheads mark the ThEPC neurons. GFP expression was monitored between 2 and 4 days. |

Ablation of ThEPC cells at 32 hpf, related to Figure 2. (a-b′) Dorsal view, anterior to the left, MIP of Et(-1.0otpa:mmGFP)hd1 transgenic embryos before and after ThEPC cell ablation. (a-a′) White arrowheads mark the ThEPCs before ablation. (b-b′) Asterisks mark the site of ablation, white arrowheads mark the non-ablated ThEPC.The original stacks were cropped and the gamma was corrected to 0.60 for display purposes. ThEPC, thalamic-epithalamic early projecting cluster. |