
- Title
-
Myo1e impairment results in actin reorganization, podocyte dysfunction, and proteinuria in zebrafish and cultured podocytes
- Authors
- Mao, J., Wang, D., Mataleena, P., He, B., Niu, D., Katayama, K., Xu, X., Ojala, J.R., Wang, W., Shu, Q., Du, L., Liu, A., Pikkarainen, T., Patrakka, J., and Tryggvason, K.
- Source
- Full text @ PLoS One

Expression of Myo1e in human and mouse tissues. A) Myo1e expression in normal human kidney. Scale bar: 100μm. B) Myo1e expression in normal human kidney. Scale bar: 20μm. C) Co-expression of synaptopodin and Myo1e in normal human podocytes observed by immunofluorescence and confocal microscope. Scale bar: 10μm. D) mRNA expression of Myo1e in multiple mouse tissues by RT-PCR. 1=purified glomeruli, 2=kidney without glomeruli, 3=lung, 4=brain, 5=testis, 6=spleen, 7=heart, 8=muscle, 9=total kidney, 10=β-actin. Myo1e was expressed abundantly in kidney (both in glomeruli and other tissue within the kidney) E) mRNA expression of Myo1e in multiple mouse tissues by Northern blot. 1=heart, 2=brain, 3=spleen, 4=lung, 5=liver, 6=muscle, 7=total kidney, 8=testis. |
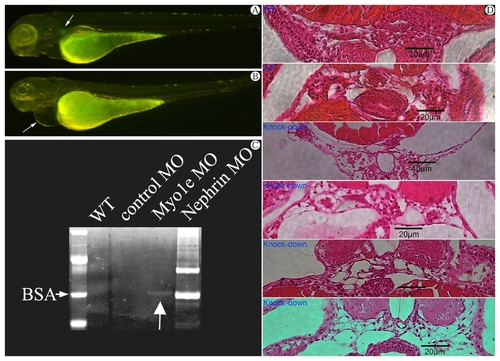
Wild type zebrafish at 4 day post fertilization (dpf).Arrow indicating the glomeruli with visible GFP. B) Phenotype of Myo1e morphants at 4 dpf (days post fertilization) with Myo1e specific knock-down morpholino injected. Note the pericardial edema (arrow) and invisible GFP indicating the destruction of glomerular structure. C) Proteinuria (arrow indicating Vitellogenin at 70kD band) in concentrated incubation medium of zebrafish larvae after MYO1E knock-down. BSA: bovine serum albumin. D) Histological sections at the level of the glomerulus in zebrafish injected Myo1e MO. The expanded Bowman’s space and destroyed glomeruli observed in MYO1E knock-down zebrafish compared with wild type zebrafish. PHENOTYPE:
|

Myo1e and F-actin expression in cultured podocytes. A) Myo1e expression in proliferative MPC5 at 33°C. B) Myo1e expression in differentiated MPC5 at 37°C. C) F-actin expression in proliferative MPC5 at 33°C. D) F-actin expression in differentiated MPC5 at 37°C. E) Myo1e expression in MPC5 (control). F) Myo1e expression in MPC5 (scrambled negative control). G) Myo1e expression in MPC5 after shRNA knock-down. Arrow: Myo1e expression was down-regulated in G than that in E & F.H) F-actin expression in controlled podocytes. I) F-actin expression in scrambled negative control podocytes. J) Change of F-actin organization in MYO1E knock-down podocytes. |

The results of MYO1E knock-down by real-time PCR and Western Blotting. A, B) Results of MYO1E knock-down by real-time PCR. C, D) The result of Western blotting of control, negative control, and MYO1E knock-down. **Compared with the results of control and negative control, Myo1e expression was noted to be down-regulated by real-time PCR and Western blotting, P<0.01. |

Migration assay of Myo1e depleted podocytes. A) Podocyte migration in control group. B) Podocyte migration in scrambled negative control group. C) Podocyte migration in MYO1E knock-down group. D) Comparison of mean migration effects of podocytes in different groups. **Compared with the results of control and negative control group, podocyte migration in the MYO1E knock-down group was down-regulated, P<0.01. |
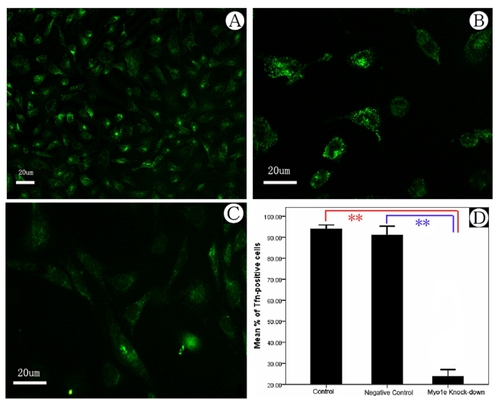
Transferrin endocytosis assay of cultured podocytes. A) Podocyte endocytosis with FITC-transferrin in control group. B) Podocyte endocytosis with FITC-transferrin in negative control group. C) Podocyte endocytosis with FITC-transferrin in MYO1E knock-down group. Arrow: podocytes with endocytic FITC-transferrin granules. D) Comparison of podocyte endocytosis in different groups. **Compared with the results from the control and negative control groups, podocyte endocytosis in the MYO1E knock-down group was down-regulated, P<0.01. |
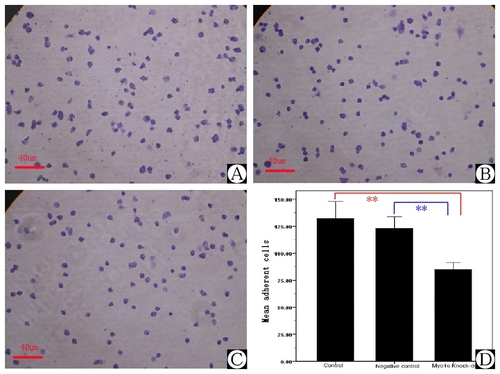
Adhesion assay of cultured podocytes. A) Podocyte adhesion in control group. B) Podocyte adhesion in the scrambled negative control group. C) Podocyte adhesion in the MYO1E knock-down group. D) Comparison of podocyte adhesion assay in different groups. **Compared with the results of the control and negative control groups, podocyte adhesion in the MYO1E knock-down group was down-regulated, P<0.05. |

Detachment assay of cultured podocytes. A) Compared with the results before treatment, the number of cells attached on bottom of the cultural bottle was significantly decreased in the three groups after PAN treatment. This phenomenon was more evident in MYO1E knock-down podocytes compared with the control and negative control groups after PAN treatment. B) The differences among the control, negative control, and MYO1E knock-down groups. **Compared with the results in the control and negative control groups, podocyte detachment in the MYO1E knock-down group was down-regulated, P<0.01. |

Myo1e expression in Heart (A), Liver (B) and Spleen (C) tissues (scale bar 100μm). D. For negative control by adding secondary antibody only in Myo1e staining in glomerular samples. |