
- Title
-
Axonal Transport Defects in a Mitofusin 2 Loss of Function Model of Charcot-Marie-Tooth Disease in Zebrafish
- Authors
- Chapman, A.L., Bennett, E.J., Ramesh, T.M., De Vos, K.J., and Grierson, A.J.
- Source
- Full text @ PLoS One
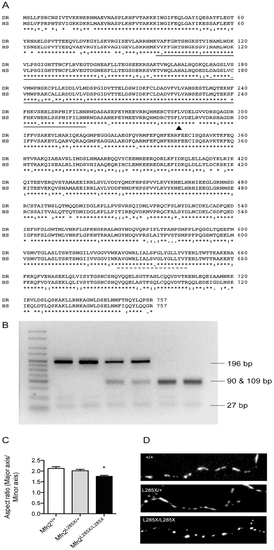
A zebrafish MFN2 mutant. (A) CLUSTAL alignment of zebrafish (Danio rerio: DR) and human (Homo sapiens: HS) Mfn2 protein sequences (Ensembl). The solid and dashed lines indicate the GTPase and transmembrane domains respectively. The site of the ENU induced point mutation (L285) is indicated with an arrowhead. (B) The ENU induced mutation creates a novel restriction enzyme site for MseI, allowing genotyping using PCR followed by MseI digest. The agarose gel shows, from left to right: Hyperladder V (Bioline), two wild type embryos (MFN2+/+), two mutation carriers (MFN2L285X/+), and two homozygotes (MFN2L285X/L285X). (C) Mitochondria in cultured MFN2L285X/L285X neurons have a significantly reduced aspect ratio (p<0.01, Kruskal-Wallis with Dunn’s multiple comparisons test). (D) Representative images of axonal mitochondria stained with Mitotracker Red in cultured neurons of the indicated genotypes. PHENOTYPE:
|
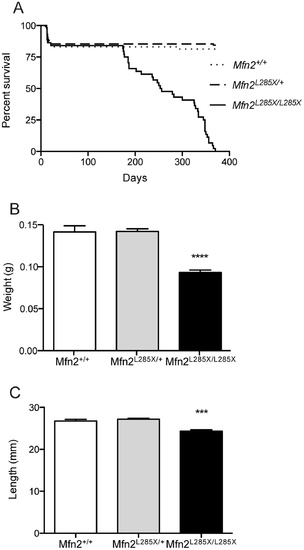
Characterisation of the phenotype of adult MFN2L285X mutant zebrafish.(A) Survival curve showing loss of viability of MFN2L285X/L285X zebrafish from 170 days onwards (p<0.0001, Log-rank (Mantel-Cox) test). (B) Bar graph of body weight for all three groups of siblings at 60–70 days old (p<0.0001, Kruskal-Wallis with Dunn’s multiple comparisons test). (C) Bar graph of the nose to tail length of MFN2L285X mutant and sibling zebrafish at 60–70 days old (p<0.001, Kruskal-Wallis with Dunn’s multiple comparisons test). PHENOTYPE:
|
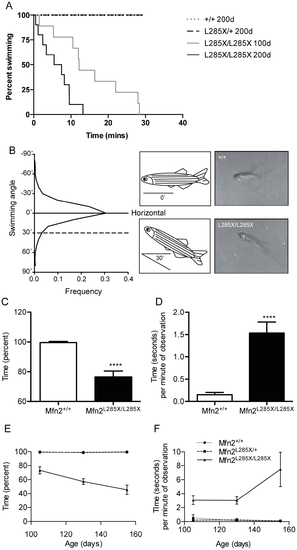
MFN2L285X/L285X zebrafish have a progressive swimming defect. (A) Kaplan-Meier plot of swimming endurance in 100 and 200 day-old zebrafish of each genotype. MFN2+/+ and MFN2L285X/+ zebrafish swam for 30 minutes at both 100 and 200d old. For clarity only the 200d data is plotted, although the lines are superimposed. (MFN2L285X/L285X: p<0.001 at both ages, Log-rank (Mantel-Cox) test). (B) Frequency distribution plot of swimming angle (measured from horizontal) of adult wild type zebrafish. Representative frames captured from digital video recordings of adult zebrafish and cartoons are shown. The upper panel shows a wild type sibling, and the lower panel shows a MFN2L285X/L285X zebrafish showing abnormal posture, with the body angled at 30° from horizontal. (C) Bar graph showing the percentage of time spent with normal swimming posture during 1 minute of observation in 90 day-old zebrafish (p<0.0001, 2-sided T test Mann-Whitney). (D) Bar graph showing the mean duration of each bout of abnormal swimming in 90 day-old old zebrafish (p<0.0001, 2-sided T test Mann-Whitney). (E, F) Graphs showing the decline in normal swimming posture (E) and the increasing duration of each bout of abnormal swimming (F), between 105 and 155 days old. PHENOTYPE:
|
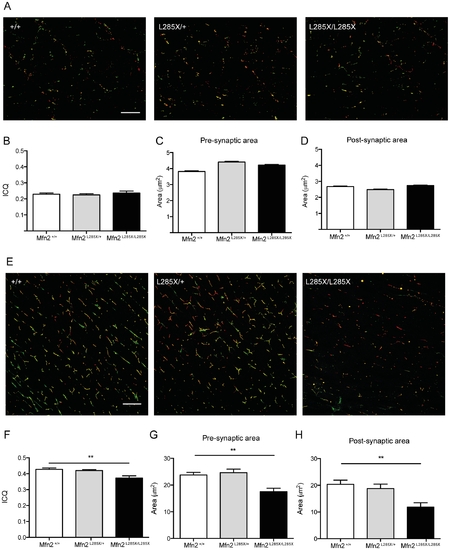
Alterations of NMJ pathology in MFN2L285X larvae (A–D) and adults (E–H). (A) Representative images of dual immunofluorescence staining of whole mount 15d larvae of each genotype for α-Bungarotoxin (green) and SV2 (red). (B) ICQ analysis of 3 larvae per group reveals no alteration of SV2/α-Bungarotoxin co-localisation in MFN2L285X/+ or MFN2L285X/L285X larvae. Compared to siblings the (C) pre-synaptic area, and (D) post-synaptic area are not significantly different in MFN2L285X/+ or MFN2L285X/L285X larvae. (E) Representative images of a-Bungarotoxin (green) and SV2 (red) in 200 day-old zebrafish. (F) ICQ is significantly reduced in MFN2L285X/L285X at this stage, and there are significant reductions in the pre- and post-synaptic area (G and H). Scale bars = 10 μm. PHENOTYPE:
|
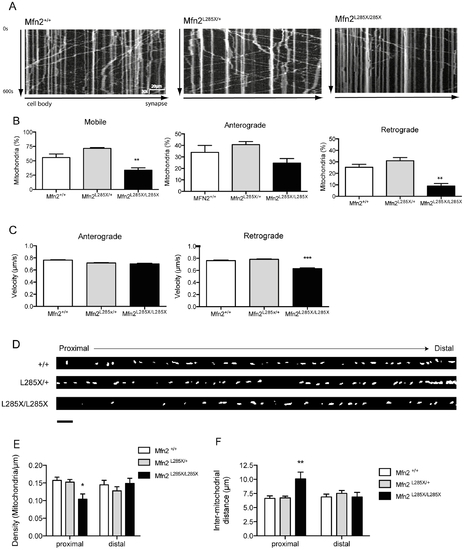
Analysis of axonal transport of mitochondria. (A) Representative kymographs showing defective axonal transport of mitochondria along axons of cultured zebrafish neurons from MFN2L285X/L285X embryos compared with MFN2+/+ and MFN2L285X/+ neurons. (B) Mitochondria in cultured MFN2L285X/L285X neurons are significantly less motile; anterograde displacement of mitochondria is not significantly altered, but retrograde displacement is significantly reduced (p<0.01, one-way ANOVA). (C) The velocity of retrograde but not anterograde mitochondrial transport is significantly reduced in cultured MFN2L285X/L285X neurons (p<0.001, Kruskal-Wallis with Dunn’s multiple comparisons test). (D) Representative images of axons from neurons of each genotype. The cell body is to the left, and distal axon is to the right hand side (scale bar = 10 μm) (E) Comparison of mitochondrial density in proximal and distal axonal segments, there is a significant reduction in mitochondrial density in the proximal but not distal segment of MFN2L285X/L285X neurons (p<0.05, 2-way ANOVA with Bonferroni’s multiple comparisons test). (F) There is a significant increase in the inter-mitochondrial distance in the proximal axon of MFN2L285X/L285X neurons (p<0.01, 2-way ANOVA with Bonferroni’s multiple comparisons test). PHENOTYPE:
|