
- Title
-
Rereplication in emi1-Deficient Zebrafish Embryos Occurs through a Cdh1-Mediated Pathway
- Authors
- Robu, M.E., Zhang, Y., and Rhodes, J.
- Source
- Full text @ PLoS One
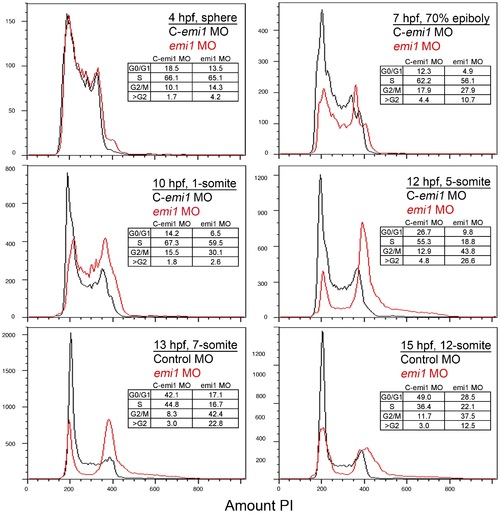
Developmental time course of emi1 morphant cell cycle defects. FACS scanning of propidium iodide (PI)-stained total cells from embryos injected with control (C, in black) or emi1-specific morpholinos (in red) (2 ng per embryo). Each panel shows an overlay of the distribution of control and emi1-morphant cells. Age and developmental stage of embryos is indicated. The insert shows the percent of cells with 2 n DNA content (G0/G1), cells replicating their DNA (S), cells with 4 n DNA content (G2/M) and cells with greater than 4 n DNA content. The percent of cells in each stage has been estimated with the Watson mathematical model in Flowjo software, except for the 4 hpf and 7 hpf time points for each we have assigned the gates for each cell cycle stage. PHENOTYPE:
|
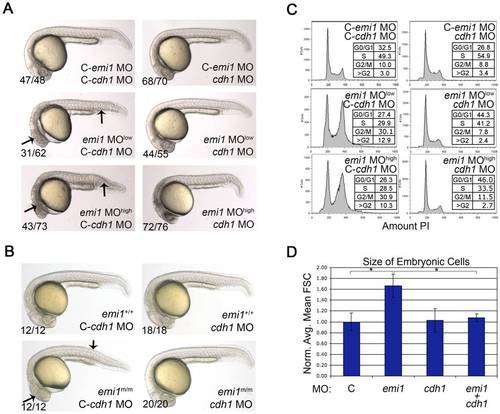
Cellular and developmental defects caused by emi1 knockdown are due to cdh1 activity. (A and B) Phase-contrast analysis of embryos at 24 hpf. (A) Morpholino injected embryos, where C- indicates the mismatch control morpholino for the indicated gene. We injected 1 ng of control and cdh1 morpholinos per embryo. The emi1 morpholino was injected at 1 ng (low) or 2.7 ng (high) per embryo. (B) Genotyped wild-type siblings (+/+) and homozygous emi1 mutant embryos (m/m) injected with 2 ng control or cdh1 morpholinos as indicated. Note the wild-type appearance of homozygous mutants and emi1 morphants that were injected with cdh1 morpholino. (C) Cell cycle analysis by FACS scanning of propidium iodide (PI)-stained cells. Total cells were analyzed from single cell suspensions of pools of the indicated morpholino-injected embryos at 4–5 somites. A representative experiment is shown. (D) The average cell size from FACS analysis of cells from morpholino-injected disaggregated embryos at 4–5 somites, normalized to the average control cell size (C, arbitrarily set at 1.00). Error bars indicate standard deviation (SD). Cell size data and SD were obtained from 3 independent experiments. PHENOTYPE:
|
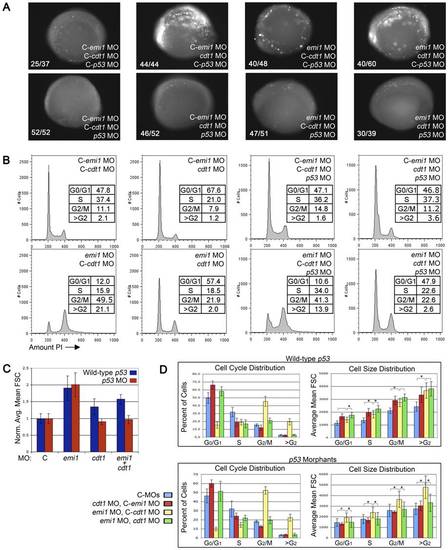
Knockdown of cdt1 partially ablates rereplication and increased cell size in emi1 morphants. (A) Cell death assay in 4–5 somite embryos injected with the indicated morpholinos. C- indicates the mismatch control morpholino for the indicated gene. We injected 2 ng emi1 MO or C-emi1 MO, 2.7 ng cdt1 MO or C-cdt1 MO, 7 ng p53 MO or C-p53 MO per embryo from a cocktail mix. Cell death was detected by immunoflurescence staining of activated Caspase 3. Note the high levels of activated Caspase 3 in cdt1 morphants and cdt1 emi1 double morphants. Co-knockdown of p53 significantly alleviated the cell death in all cases. (B) Representative PI-based cell cycle analysis of total cells from pools of 4–5 somite embryos injected with the indicated morpholinos (same doses as in A). Note that cdt1 morpholino partially, but significantly rescued the cell cycle defects in emi1 morphants. The 4 panels on the right show no significant effect of p53 knockdown on cell cycle distribution in embryos injected with cdt1 or emi1 morpholinos or both. (C) Normalized average cell size based on FACS analysis of total cells from the indicated morphants from 10 independent experiments. We removed the highest and lowest value for each sample and averaged data from 8 experiments. (D) Summary of the cell cycle and cell size distribution at different phases of the cell cycle. Top panels were obtained from p53 wild-type embryos, bottom panels show data from p53 morphant embryos. The legend indicates the morphant populations. PHENOTYPE:
|
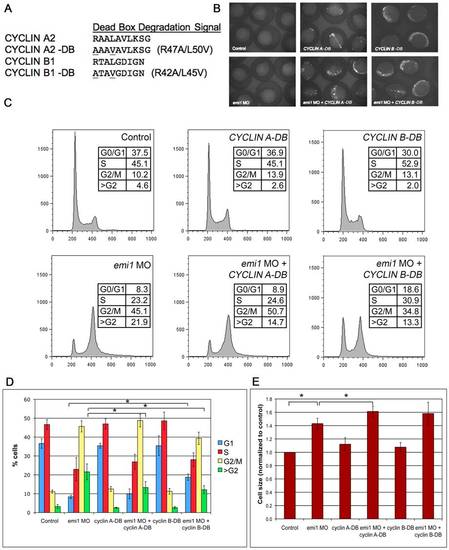
CYCLIN A2 and CYCLIN B1 expression partially inhibits rereplication in emi1-deficient cells. (A) Amino acid alignment of the dead box domain of wild-type human CYCLIN A2 and CYCLIN B1 and dead box (DB) mutant proteins. (B) Expression of CYCLIN A-DB and CYCLIN B-DB GFP fusion constructs at 5 somites, as visualized by fluorescence microscopy. Embryos injected with either DNA construct showed significant and pervasive mosaic expression at this stage and the level of expression was not altered by co-injection of emi1 MO. (C) Representative example of FACS scanning of propidium iodide (PI)-stained total cells from embryos injected with the indicated morpholinos and DNA constructs. Note the partial decrease in >G2 population in embryos injected with emi1 MO and CYCLIN A-DB as compared to emi1 MO only (quantitation in panel D). Also, embryos injected with emi1 MO and CYCLIN B-DB showed a partially decreased >G2 population and a partially increased G1 population as compared to emi1 MO only (quantitation in panel D). (D) Quantitation of the cell cycle distribution in embryos injected with the indicated morpholinos and DNA constructs. There was a significant difference between the percentage of cells with >G2 DNA content in embryos injected with emi1 MO and CYCLIN A-DB as compared to emi1 MO only. Also, there was a significant difference between the percentage of cells with >G2 DNA content and in G1 phase in embryos injected with emi1 MO and CYCLIN B-DB as compared to emi1 MO only. The results shown are average of 3 independent experiments and error bars indicate standard deviation. (E) Normalized average cell size in embryos injected with the indicated morpholinos and DNA constructs, as indicated by FSC of total cells in the FACS analysis. There was no significant decrease in the size of cells in embryos injected with emi1 MO and CYCLIN A-DB or CYCLIN B-DB as compared to emi1 MO only. If anything, there was a slight but significant increase in cell size of embryos injected with emi1 MO and CYCLIN A-DB as compared to emi1 MO only. |
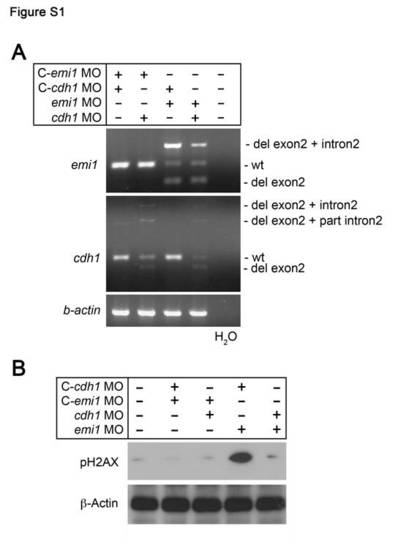
Effects of emi1 and cdh1 morpholinos on RNA splicing and phosphorylation of Histone H2AX (pH2AX). (A) RT-PCR analysis of RNA from pools of 20 zebrafish embryos following injection with mismatch control (C), emi1 or cdh1 morpholinos as indicated. The gene for which RT-PCR was performed is indicated to the left of the panels. The aberrant RT-PCR products indicated were subcloned and verified by sequencing. Both morpholinos were designed to target the exon 2– intron 2 splice-junction and caused deletion of exon 2 (indicated by “del”) and/or partial (“part”) or total insertion of intron 2. RT-PCR of beta (β)-actin is a control for RNA quality and quantity. (B) Phospho-Histone H2AX (pH2AX) Western analysis of lysates from pools of embryos injected with the indicated morpholinos. Note the increased amount of pH2AX in emi1 morphants, which is rescued back to normal levels by cdh1 knock down. |
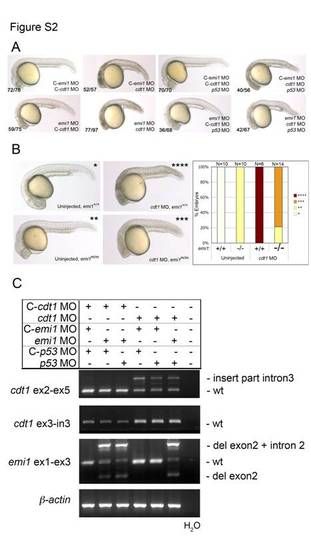
Effects of cdt1 morpholino on morphology and mRNA splicing. (A) Brightfield microscopy images demonstrate the morphology of 24-hpf zebrafish embryos after injection of the indicated morpholinos. Note that the knockdown of p53 alleviates small head and shorter body axis phenotype in cdt1 and/or emi1 morphants. (B) Brightfield microscopy images demonstrate the 24-hpf morphological phenotypes due to injecting cdt1 MO into embryos wildtype or mutant for emi1. The quantitation on the right illustrates lack of morphological rescue of emi1 defects by cdt1 morpholino. (C) Cdt1 morpholino injection results in aberrant splicing of cdt1 transcripts (mainly partial insertion of intron 2). RT-PCR analysis was performed with RNA from pools of 20 embryos injected with the indicated morpholinos. Splicing of cdt1 was analyzed using primers in exon sequences that surround the target exon 3 (top panel). Inclusion of intron 3 in transcripts was assayed using primers targeting exon 3 (forward) and intron 3 (reverse) sequences. Note the (exon 3– intron 3) background product in control MO-injected embryos, which could results from unspliced transcript or genomic DNA contamination. Knockdown of cdt1 did not affect the emi1 splicing defects caused by emi1 morpholino (third panel form top). Co-injection of p53 morpholino did not alter the splicing patterns of either cdt1 or emi1 transcripts. RT-PCR of beta (β)-actin was used as a control for RNA quality and quantity (bottom panel). |