
- Title
-
PYK2: A calcium-sensitive protein tyrosine kinase activated in response to fertilization of the zebrafish oocyte
- Authors
- Sharma, D., and Kinsey, W.H.
- Source
- Full text @ Dev. Biol.

Detection of PYK2 in the oocyte plasma membrane; effect of fertilization. Plasma membrane fractions prepared at 7.5 min post-fertilization were analyzed by western blot and probed with an antibody to the mammalian PYK2 protein, anti-PY402, anti-PY579, or with control rabbit IgG as described in ‘Materials and Methods’ (panel A). To detect changes in PYK2 phosphorylation after fertilization, plasma membrane samples prepared before (UF) and at 1, 2.5, and 10 min post-insemination (m.p.i.), were probed with the anti-PYK2 protein antibody and with the anti-PY579 antibody (panel B) to establish whether the amount or activation state of PYK2 associated with the plasma membrane changed in response to fertilization. Band intensity (‘Materials and Methods’) of the PYK2 PY579 labeled material in panel B was normalized to the PYK2 labeled bands in samples from five membrane preparations and is presented as a bar graph in panel C +/ S.E.M. EXPRESSION / LABELING:
|
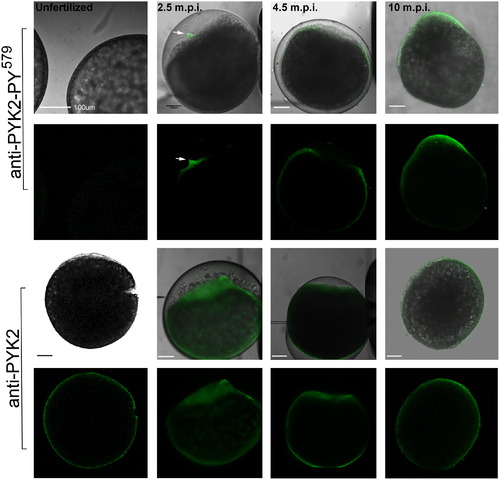
Localization of activated PYK2 in the fertilized oocyte. Oocytes were fixed before and 2.5, 4.5, and 10 m.p.i., then processed for immunofluorescence, labeled with anti-PYK2-PY579 (upper panels) which would detect the activated form of PYK2 or with anti-PYK2 peptide (lower panels) which would detect the total pool of PYK2 protein. Bound antibody was detected with alexa 488-coupled secondary antibody (green) as described in “Materials and Methods”. Since the chorion formed a barrier to antibody diffusion, it was punctured multiple times with a micropipette after fixation or removed by dissection in samples fixed after it was fully elevated (10 m.p.i. and later). Magnification is indicated by the bar which represents 100 μm. EXPRESSION / LABELING:
|

PYK2 activation co-localized with actin cytoskeletal reorganization. Oocytes were fixed at 1.0 (panels A–C) and 2.5 m.p.i.(panels D–F), then labeled with alexa 565—phalloidin (red) and anti-PYK2-PY579 followed by alexa 488-goat anti-rabbit IgG (green). Confocal images are displayed showing actin in the red channel (A and D), phosphorylated PYK2 in the green channel (B and E), or the merged red and green channels (C and F). Magnification is indicated by the bar which represents 100 µm. (For interpretation of the references to color in this figure legend, the reader is referred to the web version of this article.) EXPRESSION / LABELING:
|

PYK2 activation during cleavage and epiboly. Developing embryos were collected at 55, 120, and 240 m.p.i., then processed for confocal immunofluorescence with anti-PYK2 PY579 as in Fig. 2. Magnification is indicated by the bar which represents 100 μm. |

Effect of changes in intracellular calcium on PYK2 activation state in the zebrafish oocyte. In order to establish whether oocyte PYK2 could be activated by artificially increasing intracellular calcium levels Oocytes were injected with injection buffer only as a control (A) or with injection buffer containing 25 μM IP3 (B) to artificially drive an increase in intracellular free calcium levels. The control and IP3-injected oocytes were maintained in Hanks-BSA for 4.5 min then fixed. In order to establish whether prevention of the fertilization-induced calcium transient would block PYK2 activation in response to fertilization, oocytes were injected with calcium clamping buffer (C) then fertilized by a mixture of sperm and aquarium water, followed by fixation at 4.5 m.p.i. Oocytes were then prepared for immunofluorescence detection of activated PYK2 with anti-PYK2-PY579 and images representative of three experiments performed with five oocytes in each group are presented with green fluorescence representing the distribution of PYK2-PY579 labeling. Arrows in panel C point out the position of the micropyle. In separate experiments designed to confirm that the above treatments had the desired effect on intracellular calcium signaling (bottom panels), oocytes were first preloaded with 50 μM calcium-green dextran, and allowed to recover for 30 min. The injection pipet was replaced, calcium induced fluorescence recording was begun, and a second injection with injection buffer (Panel A, bottom), injection buffer with 25 μM IP3 (Panel B, bottom), or with calcium clamping buffer followed by in vitro fertilization (panel C, bottom) was performed after a baseline was established. The relative change in calcium green fluorescence over time is depicted graphically in the bottom panels which show patterns representative of the five oocytes from each group that were recorded. (For interpretation of the references to color in this figure legend, the reader is referred to the web version of this article.) |

Effect of PYK2 inhibitors on fertilization. Oocytes were treated with AG17, PF04594755, AG82 (control) or DMSO (solvent control) for 45 min, then washed with Hank′s-BSA. Other groups were injected with different concentrations of GST-PERM or GST fusion proteins. The samples were fertilized, then fixed and stained with DAPI at 15 m.p.i. to assess sperm incorporation by the presence of male and female pronuclei, and at 90 m.p.i. to assess cleavage by the presence of a cleavage furrow and two somatic nuclei. An example of zygotes derived from control (DMSO) treated oocytes demonstrating the presence of two pronuclei (A, arrows) and a polar body (pb) demonstrates the criteria for sperm penetration. Panel B demonstrates the presence of a cleavage furrow and two somatic nuclei shown (B, arrows) during telophase of the second mitotic division indicating that fertilization was successful. The % of oocytes that successfully incorporated sperm (C and D, left) or cleaved to the 2-cell stage (C and D, right) are presented as the mean of > three experiments +/ S.E.M. Values represent the mean of three or more experiments +/ S.E.M. (*)=significantly different from control (P<0.05). |

Effect of PYK2 inhibitors on actin reorganization post-fertilization. Oocytes injected with GST-PERM (2.5 μM final) were fertilized and fixed at 2.5 and 4 m.p.i. The distribution of actin was detected with alexa-565-phalloidin (red). Arrows indicate the position of the defective fertilization cone. (For interpretation of the references to color in this figure legend, the reader is referred to the web version of this article.) |

Effect of calcium on plasma membrane associated PTK activity. Zebrafish oocytes (1000) were fractionated and aliquots of the ‘light plasma membrane fraction’ (Wu and Kinsey, 2000) containing 10 μg protein were incubated in kinase assay buffer adjusted to contain different concentrations of CaCl2 indicated at the top of the figure. Calmodulin (1 μM) was added to a fourth reaction (*). Samples were incubated at 37 °C for 1 min, after which SDS-sample buffer was added and samples were resolved by SDS-PAGE, treated with 0.5 M KOH,to preferentially hydrolyze P-Ser and P-Thr, then the remaining 32PO4—Tyr was detected by autoradiography. The position of Mr standards is indicated at left and the 120 KDa calcium/calmodulin-sensitive band is indicated by the arrow. |
Reprinted from Developmental Biology, 373(1), Sharma, D., and Kinsey, W.H., PYK2: A calcium-sensitive protein tyrosine kinase activated in response to fertilization of the zebrafish oocyte, 130-140, Copyright (2013) with permission from Elsevier. Full text @ Dev. Biol.