
- Title
-
Two origins of blastemal progenitors define blastemal regeneration of zebrafish lower jaw
- Authors
- Wang, X., He, H., Tang, W., Zhang, X.A., Hua, X., and Yan, J.
- Source
- Full text @ PLoS One
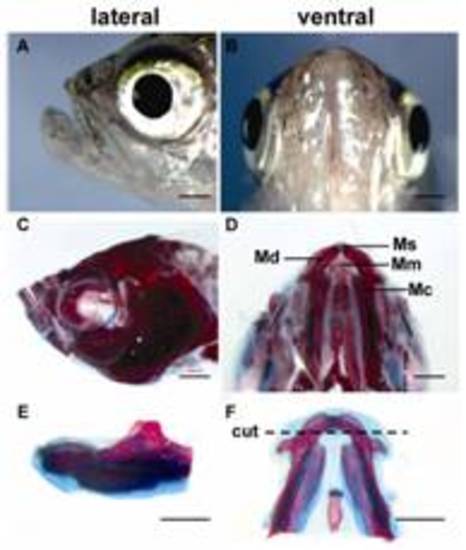
Anatomical structure and regenerative capability of zebrafish lower jaw. C–F, Alcian blue staining of bone and cartilage of lower jaw. The dotted line demarcates the amputation plane. Md, mandible; Ms, mandibular symphysis; Mc, Meckel′s cartilage, Mm, mandibular muscle. Scale bars, 1000 μm. |

Homeostasis, inflammatory infiltration and reepitheliation at the early stage of lower jaw regeneration. As regular wound healing, homeostasis began immediately after amputation (0 hpa), followed by an inflammatory infiltration and epithelia regeneration (4 hpa). At 8 h post-amputation (8 hpa) as the infiltrated nucleated blood cells decreased under the provisional basement membrane, the epidermis-forming cells increased. After 12 hpa, the wound was closed by the stratified epithelia adhering to the underlying dermal matrix. Cut sites are indicated. Scale bars, 100 μm. |

Regenerative capability of zebrafish mandible. The regenerated bone and cartilage are shown by Alcian blue staining. The first occurrence of the mandible regeneration was the chondrogenic differentiation indicated by cartilage blue-staining (10 dpa). At 21days after amputation, new bone formation began in an anterior direction and maintained the shape of the mandibular arch. In the following days, the cartilage blue-staining was reduced while red-skeletal stains increased. By two months the regenerated two ridges (mandibles) converged medially. Different from the uncut mandibular bones that were separated by a cartilaginous median symphysis, the regenerated mandibles appeared to fuse at the midline. Ms, mandibular symphysis; Ds, dorsal; V, ventral. Scale bars, 500 μm. |

Histological observation of blastema formation and reformation. Figure A shows that regeneration of the mandible retains the original mandibular arch. The cut arch (arrow) at 2 dpa was restored to the original shape (uncut) at 60 dpa. HE staining. Scale bars, 250 μm. Figure B shows blastemal structure and extracellular matrix composition. At 2 hpa, wound epidermis reconstitution started (blue arrow), and blastema was not yet formed between wound epidermis and the injured muscle. At 5 dpa, the blastemal ECM began to reorganize toward hypodermis (vertical red arrow) and the chondrogenic center (horizon red arrow). In comparison with HE stains, Alcian blue-Ponceau S staining shows hyaluronic acid and hyaline cartilage as blue, collagen and mineralized bone matrix as red; In a modification of Masson′ trichromal staining, green or blue staining is collagen; brown staining is elastic fibers; red is cytoplasm, muscle, nerve sheathe, fibronectin and erythrocytes). Scale bars, 50 μm. Figure C shows two types of chondrogenic ossification. After blastema formation (8 dpa), chondrogenic blastema was composed of three chondrogenic ossification centers: two Meckel-lateral centers (Mlc) and one median symphysis center (Msc). In the Meckel-lateral centers, perichondral ossification was more like atypical or incomplete endochondral ossification. The surrounding matrix became calcified while the central portion of ossification center developed to bone cysts (BC), a similar structure like bone marrow cavity filled with little connective tissues (120 dpa). The median symphysis center, however, adopted perichondral ossification. Scale bars, 100 μm. |

Cellular constitution of wound epidermis and blastema. Figure A shows morphological transitions of wound epidermis cells. At 12 hpa, different types of cells were observed to mount the epidermis. At 24 hpa, these cells became epidermal types and well organized. Scale bars, 25 µm. Figure B shows blastema formation and cellular transitions from 2 dpa to 4 dpa. At 2 dpa, multiple cell types contributed to blastema formation. By 4 dpa, almost all types became mesenchymal cells. fbc, fibroblast cells (indicated by arrow); nbc, nucleated blood cells; fmc, fragmented muscle cell. Because zebrafish red blood cells are nucleated, the notion of nucleated blood cells here includes undifferentiated BMMSCs, and immature and mature hematopoietic cells that have nuclei. Scale bars, 50 μm. Figure C shows regeneration of pigment cells in the blastema region. Before amputation (uncut), black and brown pigment cells are present predominantly at the dorsal epidermis and hypodermis as arrows indicated. At 2 hpa, a few pigment cells were seen in the wound (2 hpa). Gradually yellow pigment cells increased and appeared mostly along the blastema surrounding area (5 dpa). At 8 dpa, mix-colored cells spread over the whole blastema region (indicated by a dotted circle). No any stain was used. Scale bars, 500 μm. |

Genetic identification of blastemal cells. Transcriptomal analyses of selected cell identity genes at discrete four time points during regeneration (A, C). The marker genes were selected according to the published data (referenced in the text). Figure A shows differential expression of tissue specific progenitor markers of neural crest cell and mesodermal progenitors. isl1 was temporally and highly activated at 2 hpa. foxi1 was activated at 2 hpa and maintained activation at 2 dpa and 5 dpa. The similar expression pattern occurred to pax3a. In contrast, sox9a was not activated until 5 dpa. Figure C shows differential expression of pluripotency-associated genes. It also includes the other three genes (tert, hsp90a1 and msxb), which have been reported to be regeneration-associated. Pluripotency-associated genes were selectively activated at 2 hpa except that sox2 was activated at 5 dpa. Asterisk indicates significant (P<0.05) upregulation of gene expression compared to the previous time point. Figure B shows localization of the cell identity markers in blastema at 5 dpa. The expression domains of foxi1, sox9a and hoxa2b were partially overlapped in the blastema chondrogenesis zone (red ring). hoxa2b was widely expressed with island-like distribution in chondrogenic blastema. pax3a was expressed in the regenerating muscle (arrow head). hoxa11b was highly expressed in blastemal mesenchyme and arranged in the directions toward the hypodermis (horizon arrow) and the mandibular muscle (vertical arrow). The consecutive sections were used for HE staining and RNA-in situ hybridization. Mc, Meckel cartilage; Coc, chondrogenic center; Mm, mandibular muscle; hDm, hypodermal mesenchyme. Scale bars, 50 μm. |

foxi1 is important for reformation of chondrogenic blastema. In comparison with control morpholino-treated animals, foxi1 vivo morpholino treatment disturbed the reformation of chondrogenic blastema at 5 dpa. In the control slides, foxi1, sox9a and hoxa2b were widely expressed in the chondrogenic blastema. Each gene had its distribution patterns (red dotted circles) and partly overlapped with other genes. After foxi1 knockdown, foxi1- and sox9a-expression cells reduced (black dash-dotted circle) and appeared to be congregated in the areas close to the damaged mandible and the Meckel′s cartilage. Hoxa2b-expressing cells were delocalized and particularly accumulated in the center of blastema (black dash-dotted circle). Scale bars, 50 μm. |
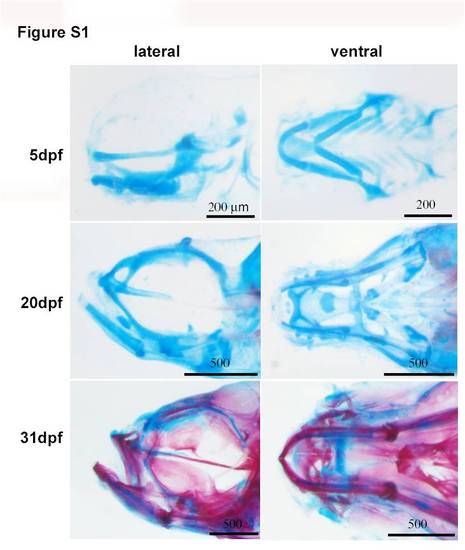
Development of larval head bone and cartilage. The figures show the process of chondrogenesis and bone ossification by Alcian Blue staining. At 31 dpf, certain parts of cartilages retain unossified. Dpf, days post-fertilization. Scale bars, 200 μm or 500 μm. |

Expression status of foxi1, sox9a, hoxa2b and hoxa11b in uncut mandible. All four genes showed a weak expression status. Particularly sox9a expression was not detectable. foxi1 and hoxa11b exhibited a wide-range of lower expression pattern. hoxa2b expression was clearly observed in the mandibular bone, Meckel cartilage and on the surface of apical epidermis. Scale bar, 100 μm. |

Expression patterns of hoxa2b and hoxa11b at the larval stages of zebrafish. During embryonic development, hoxa2b was early expressed at the head and anterior region of trunk. In comparison, hoxa11b expression domain covered more posterior segments. At 60 hpf, hoxa11b expression was accumulated in the developing kidney region (red arrow). Scale bar, 500 μm. |