
- Title
-
A new zebrafish model of Oro-intestinal pathogen colonization reveals a key role for adhesion in protection by probiotic bacteria
- Authors
- Rendueles, O., Ferrières, L., Frétaud, M., Bégaud, E., Herbomel, P., Levraud, J.P., and Ghigo, J.M.
- Source
- Full text @ PLoS Pathog.

Life expectancy and colonization of zebrafish swimming larvae infected by different pathogenic bacteria. A. Life expectancy of axenic zebrafish larvae exposed by bath at 6 dpf to E. coli, E. ictaluri or other pathogenic bacteria. Mean survival is represented by a large hyphen. Standard deviations are also indicated. Asterisks indicate significant difference from non-infected population (*p<0.05, **p<0.01, ***p<0.001). B. Colonization of zebrafish larvae infected by different pathogenic bacteria. CFU counts of axenic zebrafish larvae exposed by bath at 6 dpf to E. ictaluri and other pathogenic bacteria. Mean and standard deviations are indicated. (n = 5). C. Colonization of zebrafish gut monitored at 9 dpf ( = 3 days post infection) by transmitted light microscopy (left) and whole-mount immunohistochemistry using a polyclonal antibody recognizing Gram-negative bacteria (right). Arrows indicate bacterial localization within the gut. |

Localization of E. ictaluri in infected gnotobiotic zebrafish larvae. At 3 days post-infection ( = 9 dpf), germ-free zebrafish larvae exposed at 6 dpf to E. ictaluri were analyzed by whole-mount immunofluorescence. Germ-free 9 dpf zebrafish larvae were used as control. A. Localization of E. ictaluri in infected larvae. E. ictaluri cells (red) were detected with a stereomicroscope by immunofluorescence using a polyclonal antibody recognizing Gram-negative bacteria, including E. ictaluri. White arrows pinpoint E. ictaluri main infection sites on zebrafish head and gut. Yellow arrows pinpoint non-specific labeling. B. Details of E. ictaluri insertion in larval intestinal tissue. Clusters of E. ictaluri cells (shown by large white arrows) were observed by confocal microscopy outside the gut lumen, surrounded by zebrafish intestinal cells (nuclei stained in blue). Left panel: 10× objective, transmitted light and red (bacteria) fluorescence overlay; central panel: 40× objective, transmitted light, dashed red lines indicate gut lumen boundaries; right panel: 40× objective, red (bacteria) and blue (nuclei) fluorescence overlay. C. 10× objective. Confocal fluorescence picture of larval head infected by E. ictaluri (red). Zebrafish cell nuclei are shown in blue (DAPI staining). D. Analysis of larval rostrum by fluorescence and Nomarski optics. White arrow shows a bacterial abscess within the oral cavity, whereas the yellow arrow pinpoints E. ictaluri clusters co-localized with external skin lesions. White bars = 50 μm. |
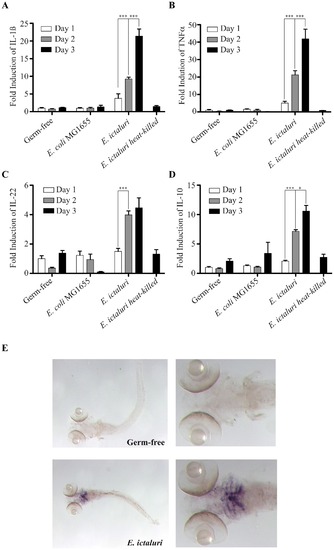
Characterization of the gnotobiotic zebrafish larva immune response to E. ictaluri infection. Kinetics of inflammation marker expression in zebrafish larvae. qRT-PCR was performed using primers specific to il1b (A), tnfa (B), il22 (C) and il10 (D) (inflammation markers) on RNA extracted from pools of germ-free zebrafish larvae or larvae exposed to E. coli MG1655 (control) or E. ictaluri at 1, 2, and 3 days post-infection or heat-killed 3 dpi E. ictaluri. Levels were standardized to levels of uninfected axenic fish, presented results are mean±SEMof three biological replicates. Asterisks indicate significant difference determined by two-way ANOVA with Bonferroni correction (*p<0.05, **p<0.01, ***p<0.001). E. Localization of il1b expression in zebrafish larvae performed by in situ hybridization on whole-mounted zebrafish larvae treated at 3 dpi. |
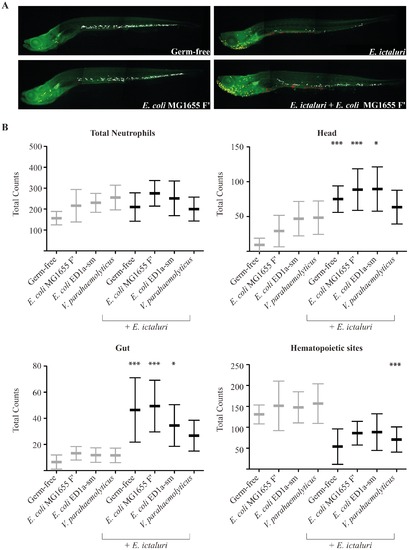
Comparative analysis of neutrophil distribution in pretreated larvae infected or not by E. ictaluri. The distribution of neutrophils after E. ictaluri infection was examined at 9 dpf in mpx:GFP larvae stained with an anti-GFP antibody (n = 5 to 10 per condition) (A) Representative pictures from which neutrophils were manually counted are shown. Total neutrophils consist of all visible neutrophils except those in the kidney, which is too deep and too dense for cells to be accurately counted. Among these, three subpopulations were counted: head (yellow dots), hematopoietic sites in the trunk and tail (white dots) and gut (red dots). (B). Neutrophil counts; statistical significance was calculated between the corresponding pretreated larvae infected and non-infected by E. ictaluri. (*p<0.05, **p<0.01, ***p<0.001). |

Protocol and timeline of axenic zebrafish infection and co-infection used in this study. After fertilization, eggs are sterilized and kept in sterile, autoclaved mineral water at 28°C in vented cap cell culture flasks until 6 dpf. Zebrafish larvae are then transferred one-by-one into 24-well microtiter plates containing 2 ml of water per well. Starting at 4 dpf, larvae are fed every 2 days with axenic T. thermophila till day 15. For longer experiments, in addition to Tetrahymena, larvae were also fed axenic A. salina from 10 dpf onwards. Pathogenic bacteria are added to the water at 6 dpf for 6 h and then larvae are transferred to fresh water. To test the protective effect of potentially probiotic strains, larvae were pre-colonized by commensal bacteria diluted in water at 4 dpf, after hatching. |

Neutrophil localization upon pathogen infection. Neutrophil infection in germ-free mpx::gfp larvae infected with E. coli MG1655 (control) or different pathogens. At 4 days post-infection, larvae were fixed and analyzed by whole-mount immunofluorescence. Neutrophils were detected as GFP-expressing leukocytes (green). A quantification of gut-associated neutrophils in infected larvae is indicated on the right for each group of larvae. Note also GFP-expressing enterocytes as indicated by white arrow. |