
- Title
-
Zebrafish transgenic lines co-expressing a hybrid Gal4 activator and eGFP in tissue-restricted patterns
- Authors
- Gupta, P., Zhao, X.F., Prat, C.R., Narawane, S., Suh, C.S., Gharbi, N., Ellingsen, S., and Fjose, A.
- Source
- Full text @ Gene Expr. Patterns
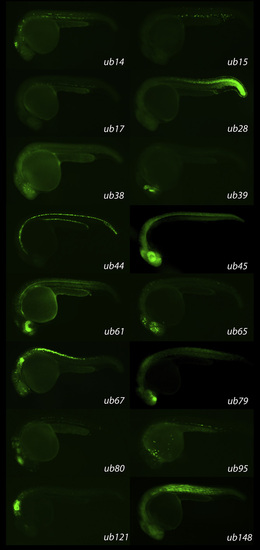
Expression patterns of eGFP in embryos of stable transgenic SAGVG lines. The images show lateral views of zebrafish embryos at 1 dpf, with the line numbers indicated. For individual lines, the tissues showing eGFP expression are listed in Table 1, and more detailed images of expression patterns are shown in Figs. S1–16. EXPRESSION / LABELING:
|
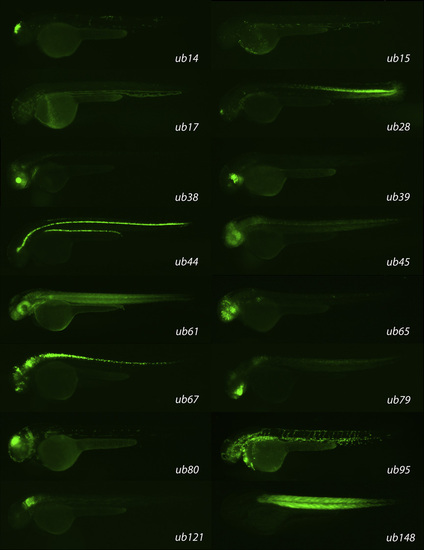
Expression patterns of eGFP in larvae of stable transgenic SAGVG lines. The images show lateral views of zebrafish larvae at 2 dpf, with the line numbers indicated. For individual lines, the tissues showing eGFP expression are listed in Table 1, and more detailed images of expression patterns are shown in Figs. S1–16. EXPRESSION / LABELING:
|
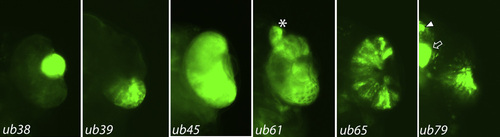
Distribution of eGFP labeled cells in stable transgenic SAGVG lines with retina-specific expression patterns. The images show ventral views of retinae (anterior at the top) from zebrafish larvae at 3 dpf, with the line numbers indicated. In ub79, arrows and arrowheads indicate additional sites of eGFP expression in the diencephalon and telencephalon, respectively. A star marks the eGFP labeled olfactory placode in ub61. EXPRESSION / LABELING:
|
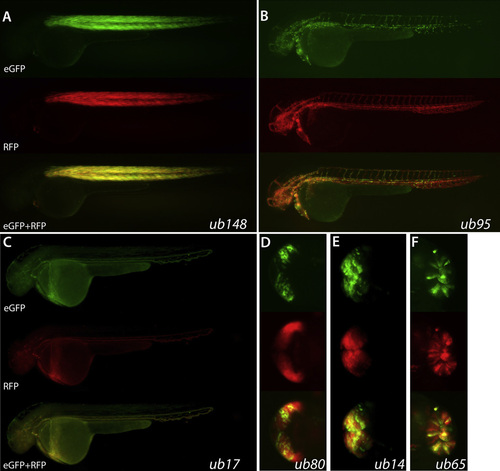
Comparison of eGFP expression and Gal4-VP16 transactivation of a UAS:RFP transgene. Expression of eGFP and RFP was analysed in offspring from crosses between transgenic UAS:RFP fish and different SAGVG lines. (A) Lateral views of ub148;UAS:RFP larva at 2 dpf, showing images of eGFP (top), RFP (middle), and merged (bottom). Lateral views of ub95;UAS:RFP (B), and ub17;UAS:RFP (C) larvae at 2 dpf. Dorsal views of the midbrain region of ub80;UAS:RFP (D), and ub14;UAS:RFP (E) larvae at 2 dpf. (F) Ventral views of retina of ub65;UAS:RFP larva at 3 dpf. EXPRESSION / LABELING:
|
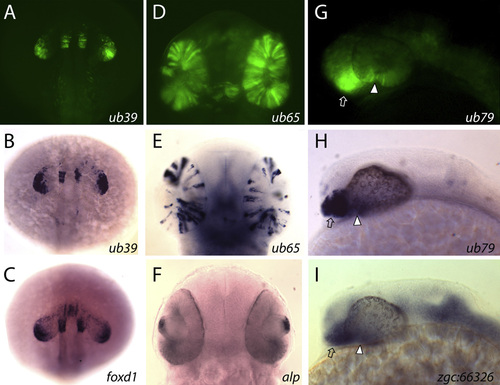
SAGVG lines and endogenous zebrafish genes with corresponding expression patterns. Dorsal-anterior views comparing ub39 eGFP labeling (A) and eGFP mRNA distribution (B) to the distribution of foxd1 transcripts (C) at 1 dpf. Comparison of ub65 eGFP labeling (D) and mRNA distribution (E) to the distribution of alp transcripts (F) at 2 dpf (D is a ventral view and E,F are dorsal views). Lateral views comparing ub79 eGFP labeling (G) and mRNA distribution (H) to the distribution of zgc:66326 transcripts (I) at 1 dpf. Arrows and arrowheads in G-I indicate areas of expression in the hypothalamus and choroid fissure, respectively. |

ZFIN is incorporating published figure images and captions as part of an ongoing project. Figures from some publications have not yet been curated, or are not available for display because of copyright restrictions. EXPRESSION / LABELING:
|
Reprinted from Gene expression patterns : GEP, 11(8), Gupta, P., Zhao, X.F., Prat, C.R., Narawane, S., Suh, C.S., Gharbi, N., Ellingsen, S., and Fjose, A., Zebrafish transgenic lines co-expressing a hybrid Gal4 activator and eGFP in tissue-restricted patterns, 517-24, Copyright (2011) with permission from Elsevier. Full text @ Gene Expr. Patterns