
- Title
-
Light and melatonin schedule neuronal differentiation in the habenular nuclei
- Authors
- de Borsetti, N.H., Dean, B.J., Bain, E.J., Clanton, J.A., Taylor, R.W., and Gamse, J.T.
- Source
- Full text @ Dev. Biol.
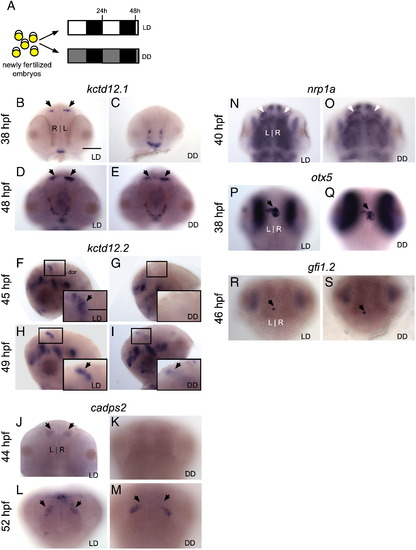
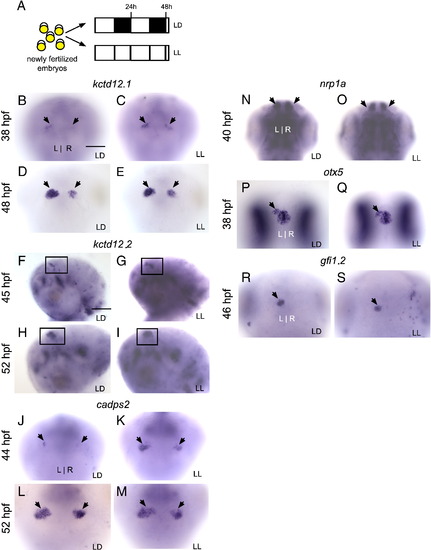
Markers of differentiating habenular neurons are delayed by constant darkness. (A) Zebrafish embryos were raised in 14/10 light/dark (LD) or constant darkness (DD) conditions beginning at 5 min post-fertilization. (B–E) Expression of kctd12.1 initiates in the habenular nuclei (black arrows) at 38 h post-fertilization (hpf) in LD but does not initiate until 48 hpf in DD. (F–M) Similarly, expression of kctd12.2 and cadps2 initiates earlier in LD than in DD conditions. Insets in F–I are magnified views of the left habenula. (N–O) By contrast, expression of nrp1a in the habenular nuclei (white arrowheads) is not delayed by DD conditions; (P–S) nor is otx5 expression in the pineal and parapineal or gfi1 expression in the parapineal (black arrows). All views are dorsal except for frontal views in B–E and lateral views in F–I. Scale bar = 50 μm except for insets in F–I (25 μm). |
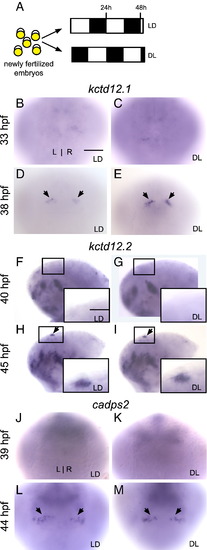
Reversal of the photoperiod phase only slightly advances the timing of gene expression in the habenular nuclei. (A) Zebrafish embryos were raised in 14/10 light/dark (LD) or 10/14 dark/light (DL) conditions beginning at 5 min post-fertilization. (B–E) Expression of kctd12.1 is absent at 33 hpf in the habenular nuclei and initiates at 38 hours post-fertilization (hpf) in LD (black arrows). Expression is higher in DL than in LD embryos. (F–M) Expression of kctd12.2 and cadps2 initiates at the same time in LD and DL conditions. Insets in F–I are magnified views of the left habenula. All views are dorsal except for lateral views in F–I. Scale bar = 50 μm except for insets in F–I (25 μm). |
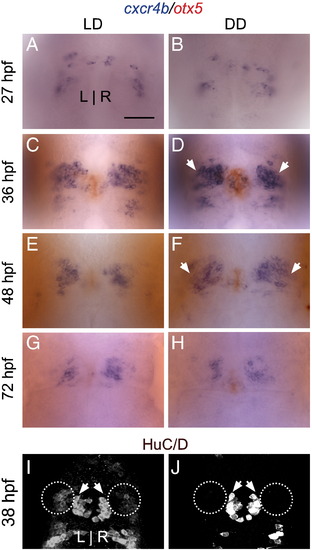
Habenular progenitor cells accumulate in an undifferentiated state in constant darkness. (A–B) A similar number of cxcr4b-positive habenular progenitor cells are specified at 27 hpf in LD and DD. (C–F) However, at 36 and 48 hpf, many more progenitor cells accumulate in DD conditions than in LD. (G–H) By 72 hpf, only a few progenitor cells are detected in LD or DD. (I–J) At 38 hpf, fewer HuC/D-positive post-mitotic precursor cells are detected in the habenular nuclei (white ovals), consistent with the retention of habenular cells in a progenitor state. HuC/D-positive projection neurons in the pineal complex (white arrowheads), meanwhile, are unaffected by DD conditions (average of 22 cells in LD versus 21 cells in DD, p > 0.42 in two-tailed t-test). Image in J is intentionally overexposed to confirm the absence of HuC/D signal in the habenular nuclei. All views are dorsal. Scale bar = 50 μm. |
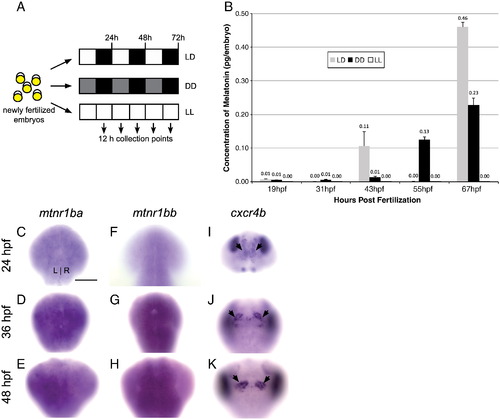
Production of melatonin is delayed under DD conditions and greatly reduced under LL conditions. (A) Zebrafish embryos were raised in 14/10 light/dark (LD), constant darkness (DD), or constant light (LL) conditions beginning at 5 min post-fertilization, and harvested for quantitation of melatonin by ELISA. (B) A 0.10 pg/embryo peak of melatonin production is detected in LD embryos at 45 hpf, in contrast to embryos under DD conditions, which reach 0.10 pg/embryo 10 h later. Melatonin concentration remains below 0.01 pg/embryo at all times in LL embryos. Graph shows the average of 3 independent experiments. (C–E) In situ hybridization for melatonin receptor 1ba (mtnr 1ba) and (F–H) melatonin receptor 1bb (mtnr1bb). Expression of mtnr1ba and mtnr1bb is found throughout the brain from 24 to 48 hpf. (I–K) In situ hybridization for cxcr4b reveals that habenular cells (black arrows) are present in the developing brain where mtnr1ba and mtnr1bb are expressed. Samples are siblings of the embryos in (C–H), photographed at the same focal plane. All views are dorsal. Scale bar = 50 μm. |

Melatonin signaling contributes to the timely differentiation of habenular neurons in constant darkness. (A) Embryos were either placed in DD and treated with melatonin or placed in LD and treated with the melatonin receptor antagonist luzindole. (B–C) Melatonin treatment under DD conditions phenocopies LD embryos: no excess precursors and (G–H) timely appearance of kctd12.1-positive neurons. (D–E) Conversely, antagonism of melatonin receptors under LD conditions results in a phenotype similar to DD embryos: accumulation of excess cxcr4b-positive precursors and (I–J) delayed appearance of kctd12.1-positive neurons. (F) Quantification of data represented in panels B–E. (K) Embryos in LD conditions were treated with the ERK1/2 phosphorylation inhibitor U0126. (L–M) A delay in the appearance of kctd12.1 neurons, similar to that seen in DD conditions, is observed. All views are frontal except A–D (dorsal views). Scale bar = 50 μm. |
Constant light is sufficient for the timely appearance of habenular neurons in the absence of melatonin. (A) Zebrafish embryos were raised in 14/10 light/dark (LD) or constant light (LL) conditions beginning at 5 minutes post-fertilization. (B–E) Expression of kctd12.1 initiates in the habenular nuclei (black arrows) at 38 hours post-fertilization (hpf) in LD and LL conditions. (F–M) Expression of kctd12.2 and cadps2 initiates at the same time in LD and LL conditions. Insets in F–I are magnified views of the left habenula. (N–O) Expression of nrp1a in the habenular nuclei (white arrowheads) is unaffected by LL conditions; (P–S) nor is otx5 expression in the pineal and parapineal or gfi1 expression in the parapineal (black arrows). All views are dorsal except for lateral views in F–I. Scale bar = 50 μm except for insets in F–I (25 μm). |
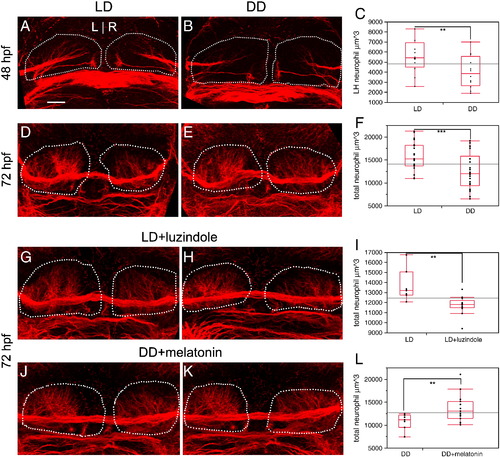
Neuropil formation in the habenular nuclei is promoted by melatonin. (A–C) At 48 hpf, the amount of dense neuropil in the left habenular nucleus is reduced by 28.5% in DD conditions, relative to LD controls. (D–F) At 72 hpf, total neuropil in both habenular nuclei is reduced by 21% in DD conditions, relative to LD controls. (G–I) Treatment with luzindole under LD conditions causes a reduction in neuropil similar to DD conditions (2 examples are shown). (J–L) Conversely, treatment with melatonin under DD conditions rescues neuropil density to be similar to LD (2 examples are shown). Dashed white lines outline the entire habenular nucleus. Neuropil quantitation includes the volume of all labeled fibers in the habenular nucleus, excluding the habenular commissure. All views are dorsal. The ends of the red rectangle in C, F, I, L are the 25th and 75th quartiles (encompassing the interquartile range); the line across the middle represents the median value, and the error bars represent 1.5 times the interquartile range. ** = p < 0.02; *** = p < 0.002 by two-tailed T test. Scale bar = 25 μm. |
Reprinted from Developmental Biology, 358(1), de Borsetti, N.H., Dean, B.J., Bain, E.J., Clanton, J.A., Taylor, R.W., and Gamse, J.T., Light and melatonin schedule neuronal differentiation in the habenular nuclei, 251-61, Copyright (2011) with permission from Elsevier. Full text @ Dev. Biol.