
- Title
-
Effects of simulated microgravity on the development of the swimbladder and buoyancy control in larval zebrafish (Danio rerio)
- Authors
- Lindsey, B.W., Dumbarton, T.C., Moorman, S.J., Smith, F.M., and Croll, R.P.
- Source
- Full text @ J. Exp. Zool. Part A Ecol. Genet. Physiol.
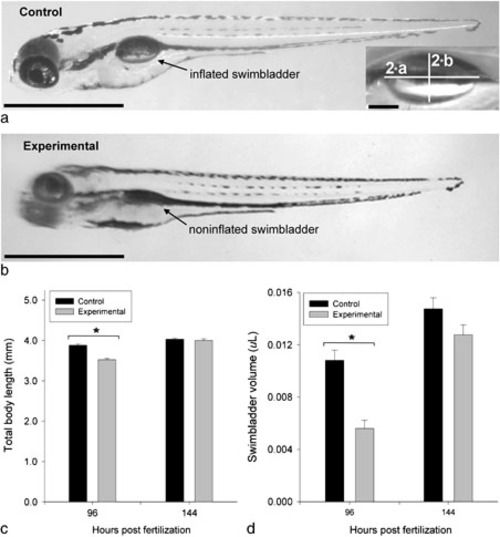
Effects of SMG on swimbladder morphology, total body length, and swimbladder volume during development. a, b: Representative photomicrographs of left lateral views of larvae with inflated swimbladders from control (a) and larvae with uninflated swimbladders from experimental (b) groups at 96 hpf. Inset shows magnified view of single-chambered swimbladder with the long (2*a) and short (2*b) axes marked for volumetric analysis, as modeled by a rotary prolate ellipsoid (see text). In b, the arrow marks the position of the uninflated swimbladder in larvae exposed to SMG. In all images of swimbladder in this and subsequent figures, cranial is to the left and dorsal is upward. c: Plots of total body length of larvae from control (black bars: n = 42) and experimental (gray bars: n = 70) groups measured at 96 and 144 hpf (control: n = 17; experimental: n = 18). d: Plots of swimbladder volumes estimated from animals that had inflated swimbladders at 96 hpf (control: n = 26; experimental: n = 10) and 144 hpf (control: n = 17; experimental: n = 18) with bar shading as in c. Asterisk (*) indicates a significant difference (independent samples t-test, P<0.001) in mean values between groups at the same time point. In panels a and b, scale bars represent 1.0 mm; in inset, 100 μm. |
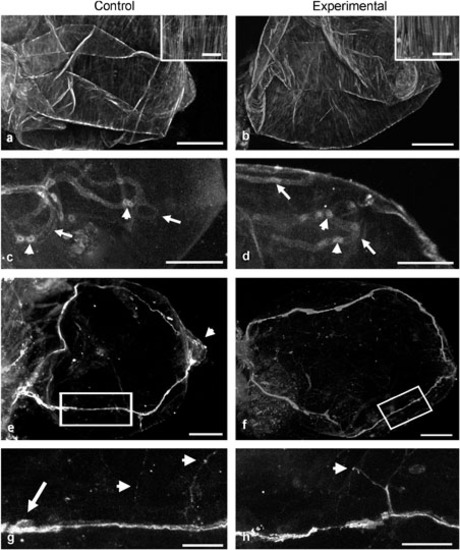
Anatomy of swimbladders from larvae at the ESC stage of swimbladder development. Panels a, c, e, g show images taken from swimbladders of control group (n = 38); panels b, d, f, h show images from swimbladders of experimental group (n = 60). b, c (insets show higher magnification views): Phalloidin labeling showed that no swimbladder muscular development was present in either group. c, d: Tie-2-like immunoreactivity showed blood vessels extending along the walls and ending in anastomotic loops (arrows) in swimbladders from both groups. Erythrocytes are visible within some vessels (arrowheads). e, f: In both groups, zn-12 immunoreactivity showed paired lateral nerves coursing to the cranial end of the swimbladder, then along the walls bilaterally before converging caudally at the apex (arrowhead). g, h: Details of regions shown within boxes in panels e and f. Numerous fine ramifications arose from lateral nerves in specimens from both groups; a putative cell body (arrow) was associated with a lateral nerve in the sample from the control group, although these cells were also observed in tissue from the experimental group (data not shown). In tissue from both groups, intensely stained structures resembling varicosities (arrowheads) occurred along many fibers. Scale bars represent: a, b, 50 μm (inset, 20 μm); c–f, 50 μm; g, h, 10 μm. |
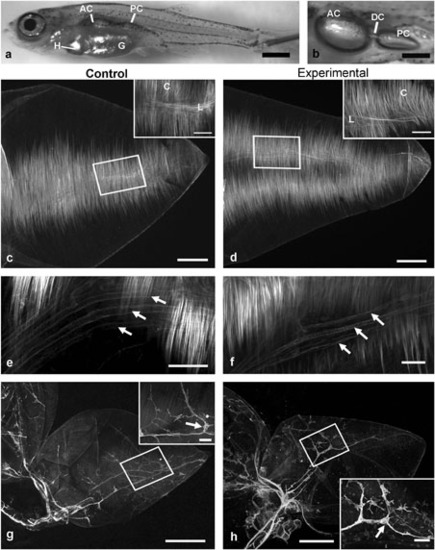
Anatomy of larval swimbladders from control (n = 8) and experimental (n = 8) groups at the LDC stage of development. a: Representative larva from control group (total body length 9.5 mm) showing anterior (AC) and posterior (PC) chambers of swimbladder in relation to the gut (G; partly obscuring swimbladder) and heart (H). b: Higher magnification image of swimbladder in situ in opened coelomic cavity; AC and PC connected by a narrowed ductus communicans (DC). Panels c, e, g show images of tissues from control group; d, f, h show images of tissue from experimental group. c, d: Phalloidin labeled smooth muscle fibers of lateral muscle bands in the wall of the PC in both groups. Boxes in main panels show locations of insets, which depict circular (C) and longitudinal (L) muscle fibers. e, f: Smooth muscle was associated with blood vessels of the rete (arrows), as demonstrated by phalloidin labeling in the wall of craniolateral portion of the PC in tissue from both groups. g, h: Zn-12 immunoreactivity showed robust neuronal staining within the walls of both swimbladder chambers and in nerves coursing to the swimbladder along the pneumatic duct (arrowhead). In each panel, insets show details of regions indicated by boxes; putative neuronal cell bodies were observed in swimbladders from both control and experimental groups (arrows). Scale bars represent: a, 1 mm; b, 0.5 mm; c, d, 100 μm (insets, 50 μm); e, f, 50 μm; g, h, 200 ^μm (insets, 50 μm). |