
- Title
-
The Actin Nucleator Cordon-bleu is Required for Development of Motile Cilia in Zebrafish
- Authors
- Ravanelli, A.M., and Klingensmith, J.
- Source
- Full text @ Dev. Biol.
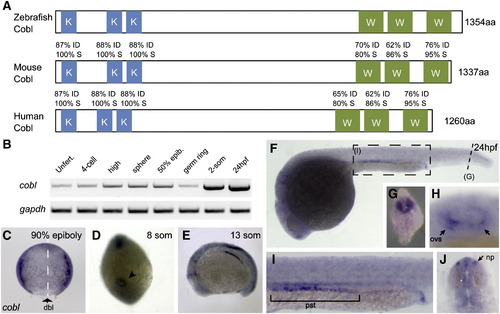
The vertebrate gene cordon-bleu (cobl) is conserved in zebrafish, with enriched expression in ciliated epithelial tissues. (A) Conservation of the KRAP motifs and WH2 domains among zebrafish, mouse and human Cobl orthologs. The two putative, conserved functional domains are colored. The proline-rich KRAP motifs show 100% amino acid sequence similarity, while three WH2 domains show 80–95% amino acid sequence similarity among these species. (B) RT-PCR amplification of cobl sequences from RNA harvested at progressively later developmental stages. Zfcobl is present in eggs and embryos prior to zygotic gene expression, and is expressed at all stages thereafter. RT-PCR for gapdh is shown as a loading control. (C) zfcobl is expressed ubiquitously at low levels during gastrulation. Here, at 90% epiboly, zfcobl shows no tissue-specific enrichment. The axial midline is marked with a dashed line. Arrow denotes the dorsal lip of the blastopore. Tissue-specific enrichment does not appear until 2 somites, in the neural keel. (D) cobl expression in Kupffer′s vesicle, denoted by arrowhead, and in the neural keel during somitogenesis. (E) cobl expression in neural keel, pronephric anlagen, otic placode and midbrain–hindbrain boundary. (F-J) cobl enrichment in ciliated epithelial tissues at 24 hpf. (G) Cross-section through posterior neural keel; (H) sensory placodes of the otic vesicle; (I) the pronephric duct; (J) nasal placodes. K = KRAP, W = WH2, mhb = midbrain–hindbrain boundary, ovs = otic vesicle sensory placodes, pst = proximal straight tubule, np = nasal placode, dbl = dorsal blastopore lip. |
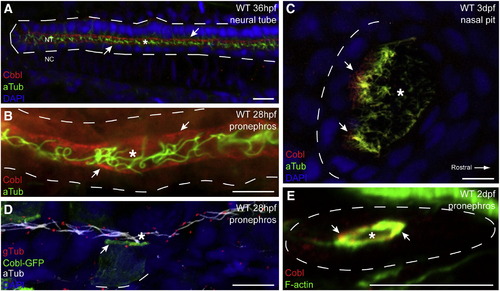
Apical localization of Cobl protein in ciliated epithelial tissues. (A) Whole mount confocal image of the caudal neural tube at 36 h post fertilization. Anti-Cobl staining reveals apical localization of Cobl in ciliated cells. Cobl is localized as distinct apical puncta, visible in the pronephric ducts at 28 hpf (B), and in the nasal placodes at 3 dpf (C). (D) mCoblGFP fusion proteins are able to concentrate apically in tissues where zfcobl is normally expressed. (E) Immunohistochemistry on transverse cryosections shows that Cobl localizes closely with apical F-actin in the pronephric duct. Arrows point to apical Cobl puncta. Asterisks denote lumens. Dashed lines demark basal laminae. F-actin (phalloidin), cilia (aTub, anti-acetylated tubulin), basal bodies (gTub, anti-gamma tubulin). EXPRESSION / LABELING:
|
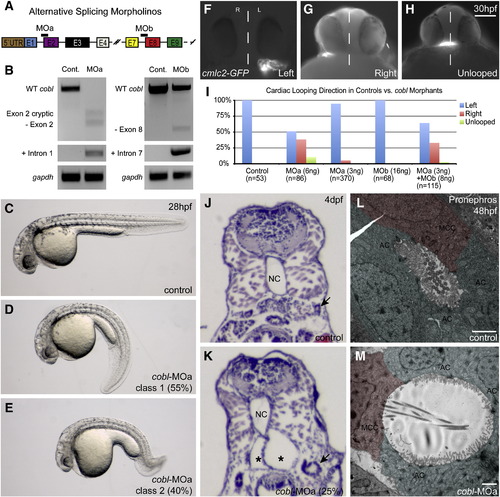
Morpholino-induced knockdown of zfcobl. (A) Morpholino target sites on cobl transcript. Zfcobl-MOa binds the intron 1–exon 2 boundary. cobl-MOb binds the intron 7–exon 8 boundary. (B) RT-PCR showing morpholino induced splice variants of cobl. cobl-MOa can induce splicing out of exon 2, use of a cryptic splice site within exon 2, or the retention of intron 1, causing a significant depletion of WT cobl. cobl-MOb can cause splicing out of exon 8 or retention of intron 7 but shows a limited effect on cobl. (C–E) Control and cobl morphant embryos at 28 hpf. Morphants display curved/twisted body and axis elongation defects (n = 642). Class 1 morphants exhibit a curved-down body shape (D). Class 2 morphants exhibit more severe defects including reduced axis length, decreased head size, curved-down body shape, and a curled posterior tail (E). Scale is the same among C–E. (F–I) Control cmlc2-GFP embryos show normal leftward jogging at 30 hpf hpf. cobl morphant embryos exhibit leftward (F), rightward (G), and unjogged (H) hearts. (I) Bar graph depicting looping direction variability of cobl morphant hearts. Embryos injected with 6 ng of cobl-MOa and synergistic doses of cobl-MOa + MOb exhibit randomized cardiac looping relative to controls and sub-threshold doses of the morpholinos. Scale bar in H represents 100 μm. (J–K) Transverse histological sections of 3 dpf morphant embryos reveal kidney cysts, not found in control embryos. NC = notochord. Asterisks mark the lumen of the glomerular cysts. Arrows in J and K point to proximal convoluted tubules. These tubules also appear dilated in morphants relative to controls. (L–M) Transmission electron micrographs of sections through the medial tubules of the pronephros at 48 hpf. Morphant tubules appear dilated and often show cilia extending perpendicular to the apical surface. Scale bars in L–M represent 2 μm. Absorbing cells (= AC) are false-colored green. Multi-ciliated cells (= MCC) are false-colored red. EXPRESSION / LABELING:
PHENOTYPE:
|
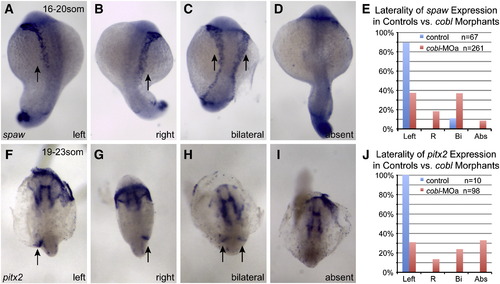
cobl morphants display abnormal left–right molecular asymmetry. RNA in situ hybridization of spaw (A-D) in control and morphant embryos from 16 to 20 somites. (E) Bar graph showing the percentage of treated embryos displaying spaw expression on the left, right (R), bilaterally (Bi) or absent expression (Abs). RNA in situ hybridization of pitx2 (F–I) in control and morphant embryos from 19 to 23 somites. (J) Bar graph showing the percentage of treated embryos displaying the pitx2 expression pattern seen in F–I. Normally, spaw and pitx2 expression is induced only in the left lateral plate mesoderm by signals originating from Kupffer′s vesicle. Morphants express these genes on either the left or right sides, both sides, or not at all. Arrows indicate expression domain of spaw and pitx2. EXPRESSION / LABELING:
PHENOTYPE:
|
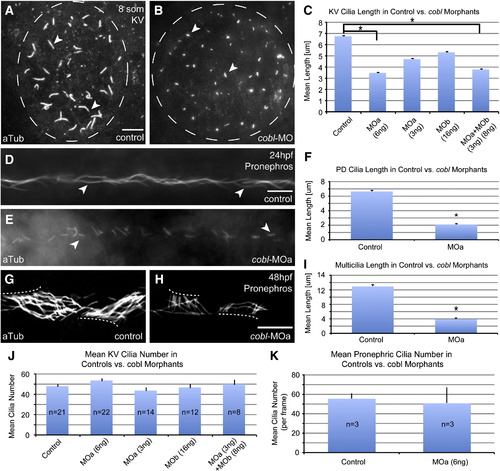
Zfcobl morphants exhibit reduced motile cilia length. Anti-acetylated tubulin staining reveals shortened cilia in Kupffer′s vesicle at eight somites in control (A) and cobl morphant (B) embryos. (C) Bar graph showing mean cilia length in microns (μm). Control embryos have a mean cilia length of 6.75 μm in Kupffer′s vesicle. KV cilia in cobl morphants show an average reduction of 20–50% in length. n values: controls = 694 cilia, MOa(6 ng) = 2011, MOa(3 ng) = 738, MOb(16 ng) = 579, MOa + MOb = 574. p value: C = < 0.0001* (each pair). (D–E) Anti-acetylated tubulin staining reveals reduced cilia length in the pronephros at 24 hpf in cobl morphants. (F) Bar graph showing mean cilia length in microns. n values: controls = 167cilia, MOa = 153. p value: F = < 0.0001*. (G–H) Anti-acetylated tubulin staining reveals reduced cilia length on multi-ciliated cells in the pronephros at 48 hpf. (I) Bar graph showing mean multi-cilia length in microns. n values: controls = 19, MOa = 20. p value: I = < 0.0001*. Cilia number is unaffected in cobl morphants relative to controls. (J) Bar graph depicting average cilia number in Kupffer′s vesicle in 8-somite control embryos vs. cobl morphant embryos. No significant difference is observed between controls and the various morphant groups. (K) Bar graph depicting average cilia number in the pronephric ducts in 24 hpf control embryos vs. cobl-MOa embryos. Z-stacks were taken through the middle region of the pronephric duct (∼ 141 μm length frame). Cilia were stained with anti-aTub and anti-gTub and counted. Error bars represent one standard error from the mean. p values for controls versus morphants all > 0.05. Bar with asterisk highlights specific significance. Arrows in A–B, D–E, G–H point to cilia. Scale bars represent 10 μm. EXPRESSION / LABELING:
PHENOTYPE:
|
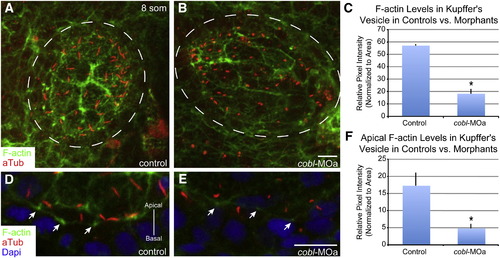
Reduction of Cobl causes a reduction of apical F-actin in Kupffer′s vesicle. (A–B) Maximum intensity projection of 0.8 μm confocal z-stacks of Kupffer′s vesicle, stained for cilia and actin. cobl morphant embryos with short cilia show deficits in the amount of F-actin staining by phalloidin. (C) Bar graph of pixel intensity of F-actin in Kupffer′s vesicle in controls vs. cobl morphants. Morphant embryos exhibit a significant decrease in the amount of F-actin. (D–E) Confocal images of cells in Kupffer′s vesicle showing cilia and F-actin. (F) Bar graph of pixel intensity of apical F-actin in Kupffer′s vesicle cells in controls vs. cobl morphants. Morphant embryos exhibit a significant decrease in the amount of F-actin present at the apical surface of cells. Dashed lines outline Kupffer′s vesicle. Arrows demark cortical F-actin. F-actin (phalloidin), cilia (anti-acetylated tubulin), DNA (DAPI). n values: control = 12, MOa = 7. p values: C = 0.0012*, F = 0.0283*. Error bars represent one standard error from the mean. Scale bar represents 10 μm. EXPRESSION / LABELING:
PHENOTYPE:
|
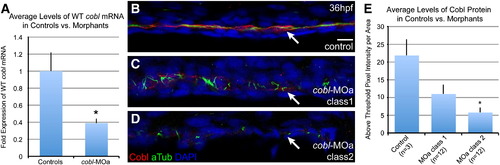
Anti-Cobl staining levels correlate with severity of morphant phenotypes. Control and cobl morphant embryos of both classes of severity were stained with anti-zfCobl and anti-acetylated tubulin, and assessed for correlations between phenotypic severity and Cobl levels. (A) Q-PCR results showing average levels of WT cobl mRNA in controls (n = 9) vs. cobl-MOa morphants (n = 30) at 24 hpf. p value = 0.0004*. (B) Control embryos show WT levels of anti-Cobl staining in the pronephric duct at 36 hpf by pixel intensity. (C-D) Morphant embryos reveal reduced anti-Cobl staining and cilia length. (E) Bar graph depicting the correlation between phenotypic class and levels of Cobl by antibody staining. p values: control/class 1 = 0.0676, control/class 2 = 0.0052*, class 1/class 2 = 0.1941. Scale bar represents 10 μm. |

Primary cilia length is unaffected in cobl morphants. Cilia in eight somite stage and 48 hpf embryos were stained with anti-acetylated tubulin and analyzed for length. Motile monocilia in Kupffer′s vesicle are reduced in length in cobl morphants (B–C) relative to controls (A). In contrast, primary cilia present on cells surrounding the KV appear unaffected in length and distribution. Motile cilia in the pronephros are reduced in length in cobl morphants (E) relative to controls (D). As before, primary cilia present in tissues surrounding the pronephros appear unaffected in length and distribution. Dashed lines outline the region magnified in the insert. Arrows point to primary cilia magnified from surrounding tissue. Kupffer′s vesicle (KV) outlined in dotted line. Multi-ciliated cells in D-E marked with an asterisk. Neuronal axons marked with an ‘n.’ Scale bars represent 10 μm. |
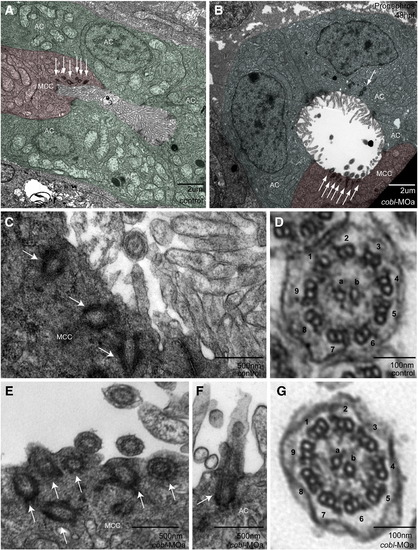
Structure and localization of basal bodies and cilia appear unaffected in cobl morphants. Transmission electron micrographs of sections through the proximal straight tubules of the pronephros in controls and morphants. (A–B) Morphant tubules appear dilated. Multi-ciliated cells (MCC) are false-colored red. Absorbing cells (AC) are false-colored green. Basal bodies appear localized to the apical surface in multi-ciliated cells (A–D) and absorbing cells (E). Cross sections through the 9 + 2 ciliary axoneme (F–G) reveal no structural difference between control and morphant cilia. Arrows point to basal bodies. Outer microtubule doublets are numbered 1–9, inner core filaments labeled a/b. |
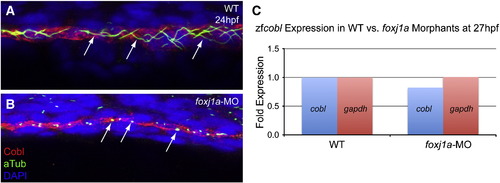
Foxj1a does not regulate Cobl expression or localization. foxj1a morphants exhibit similar overt morphological phenotypes to cobl morphants, but lack motile cilia altogether, whereas as cobl morphants have short motile cilia. (A–B) Ciliogenesis is defective in foxj1a morphants at 24 hpf, but Cobl remains localized to the apical surface. (C) zfcobl expression is not significantly altered in foxj1a morphants relative to controls. n = 5 24 hpf embryos. Arrows point to cilia. |
Reprinted from Developmental Biology, 350(1), Ravanelli, A.M., and Klingensmith, J., The Actin Nucleator Cordon-bleu is Required for Development of Motile Cilia in Zebrafish, 101-111, Copyright (2011) with permission from Elsevier. Full text @ Dev. Biol.