
- Title
-
Differential contribution of direct-developing and stem cell-derived melanocytes to the zebrafish larval pigment pattern
- Authors
- Hultman, K.A., and Johnson, S.L.
- Source
- Full text @ Dev. Biol.
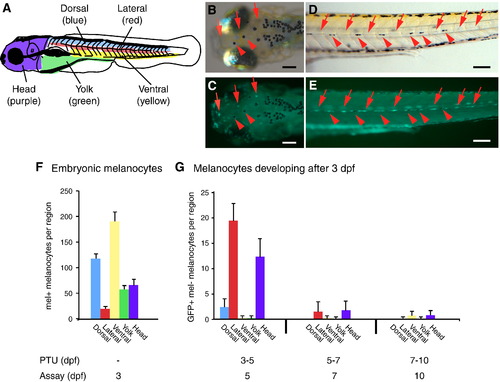
Location and time of differentiation of larval melanocytes. (A) Cartoon showing regions of embryonic and larval melanocyte quantitation. (B–E) Photos of Tg(Tyrp1:GFP)j900 larva at 5 dpf after treatment with PTU from 3 to 5 dpf showing melanocytes that differentiated prior to melanin inhibition by PTU (melanin+, GFP+, red arrowheads) and melanocytes that differentiated after melanin inhibition by PTU (melanin-, GFP+, red arrows). (B, C) Dorsal view of the head. (D, E) Lateral view showing the left-side lateral stripe. Additional, out-of-focus fluorescence is also apparent from melanocytes in the right-side horizontal myoseptum. (F) Quantitation of embryonic melanocytes in various regions at 3 dpf. Average number of melanized cells, error bars represent standard deviation, n = 10. (G) Quantitation of melanocytes that develop at 3–5 dpf, 5–7 dpf, and 7–10 dpf in these regions. Average number of GFP-positive, melanin-negative cells at time of assay, error bars represent standard deviation, n = 10. Scale bars, 100 μm. |
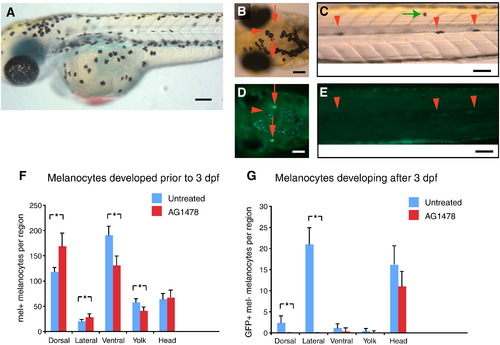
Late-stage melanocytes in the trunk are derived from the ErbB-dependent MSC. (A) Example of untreated animal at 3 dpf used for quantitative analysis. (B–D) Photos of Tg(Tyrp1:GFP)j900 larva at 5 dpf after treatment with AG1478 from 9 to 48 hpf and PTU from 3 to 5 dpf. Red arrows indicate melanin-, GFP+ melanocytes. Red arrowheads indicate melanin+, GFP+ melanocytes. (B, D) Dorsal head view. (C, E) Lateral view. Note absence of GFP+, melanin- cells in horizontal myoseptum of AG1478-treated embryos. GFP fluorescence in mel+ melanocytes (marked by arrowheads) is quenched by melanin in this photograph. (F) Quantitation of embryonic melanocytes at 3 dpf of untreated and AG1478-treated (9–48 hpf) animals. Note that while most melanocytes have reached terminal positions in untreated embryos (A), some melanocytes are still migrating ventrally in AG1478-treated embryo (green arrow in panel C) and are scored as dorsal melanocytes in our analysis. (G) Quantification of larval melanocytes that develop from 3 to 10 dpf (melanin-, GFP+ following PTU addition at 3 days) in untreated and AG1478-treated animals. In total, 40.6 ± 7.4 late developing melanocytes are observed in untreated animals, mostly in the lateral stripe and head. In contrast, only 11.6 ± 4.3 LDM form in AG1478-treated animals and are notably absent from the lateral stripe. Mean value (n = 10) with error bars representing standard deviation. ∗P-values ≤ 0.05. Scale bars, 100 μm. |
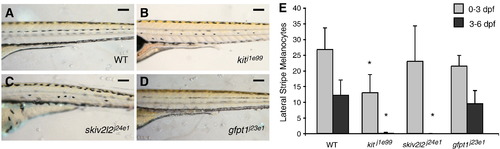
Late-stage melanocyte development in larval melanocyte regeneration mutants. Lateral trunk view at 6 dpf of (A) wild type, (B) kitj1e99, (C) skiv2l2j24e1 and (D) gfpt1j23e1. Scale bars, 100 um. (E) Quantitation of embryonic lateral stripe melanocytes at 3 dpf (light gray) and melanocytes that develop from 3 to 6 dpf (dark gray) in these mutants. Mean value (n = 10 for wild type, kitj1e99 and gfpt1j23e1, n = 4 for skiv2l2j24e1) with error bars representing standard deviation. ∗P-values £ 0.05. |
Reprinted from Developmental Biology, 337(2), Hultman, K.A., and Johnson, S.L., Differential contribution of direct-developing and stem cell-derived melanocytes to the zebrafish larval pigment pattern, 425-431, Copyright (2010) with permission from Elsevier. Full text @ Dev. Biol.