
- Title
-
Metastatic behaviour of primary human tumours in a zebrafish xenotransplantation model
- Authors
- Marques, I.J., Weiss, F.U., Vlecken, D.H., Nitsche, C., Bakkers, J., Lagendijk, A., Partecke, L.I., Heidecke, C.D., Lerch, M.M., and Bagowski, C.P.
- Source
- Full text @ BMC Cancer
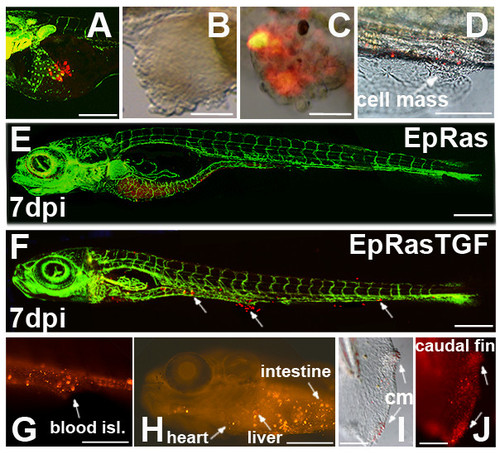
Migration and cell mass formation of Ha-Ras transformed mouse mammary epithelial cells injected into the yolk sac of zebrafish embryos. EpRas (parental) and EpRas cells stimulated with TGF-β (EpRasTGF) were labelled and ectopically injected into the yolk sac of 2 dpf zebrafish embryos. In A, E and F transgenic zebrafish embryos expressing GFP under an endothelial promotor (Tg(fli1:eGFP) were used. An example of newly injected EpRas cells at 1 hour post injection is given in (A). In (B) an ectopic tumour cell mass formed in the yolk sac by EpRasTGF cells is shown. Examples of cell masses formed by EpRasTGF cells at distance from the place of injection are shown for the tail region (C) and blood islands with surrounding ventral fin (D). Pictures in B-D were taken at 3 dpi. While EpRas cells remained in the yolk and never invaded the embryo (E), EpRasTGF cells invaded, migrated and formed distant micrometastases, which are indicated with arrows (F). Red fluorescence of cells is still visible after 7 dpi (E, F). Images G to J show tumour cell masses (cm) and migrated cells in blood islands (blood isl.), the liver, heart, intestine and the caudal fin of 6 dpi larvae. Scales shown are for A: 200 μm; D-H: 600 μm, for B, C, I and J: 100 μm. 3D reconstructions of EpRAS and EpRasTGF cells in zebrafish larvae are shown in two supplemental movies (see Additional file 3). |
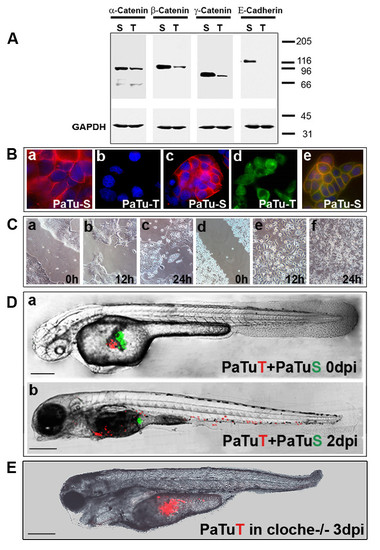
Implantation of two pancreatic cancer cell lines into the same zebrafish embryo. (A) Western blot analysis shows that PaTu-S but not PaTu-T cells express E-cadherin and both express α-, β- and γ-catenin. GAPDH expression is shown as a control. (B) Cellular localization of E-cadherin and β-catenin was analysed by immunofluoresscence. E-cadherin expression is shown for PaTu-S cells (a) and absence of E-cadherin expression for PaTu-T cells (b). Dapi staining was used to visualize cell nuclei in blue. β-catenin localization is shown for PaTu-S (c) and for PaTu-T (d). Co-localization of E-cadherin (green) and β-catenin (red) in PaTu-S cells is indicated by yellow staining of the plasmamembrane (e). (C) An in vitro migration assay (′scratch assay′) shows differences in migration of the two cell lines (PaTu-S: a-c and PaTu-T: d-f). Similar results were obtained in four independent experiments. Gap closure (gap width) over time is shown in Additional file 5. (D) Non-invasive PaTu-S cells (green) and invasive PaTu-T cells (red) were implanted consecutively in the same embryo (a and b) (Scales: 250 μm (a) and 300 μm (b)). (E) Homozygous cloche mutants [17] were injected with PaTu-T cells and followed over time. Shown is an example of a cloche-/- zebrafish at 3 dpi (scale bar: 300 μm). In contrast to control zebrafish none of the tested cloche-/-mutants showed any sign of metastatic behaviour (see Additional file 1 and Additional file 7). The cloche phenotype and its lack of a functional vasculature and circulation is observable by DIC microscopy (see Additional file 6). |

Tumour transplantation in zebrafish. Primary human tumours of the pancreas, the stomach and the colon were transplanted into 2 dpf embryos. Non-tumour tissue was used as control. At the respective time points indicated laser confocal microscopy images were taken. Images A and B show newly transplanted embryos with normal pancreas (NP) and pancreatic tumour (PT) respectively. Image C shows an example of an embryo transplanted with an adenocarcinoma of the pancreas at 1 day post transplantation (dpt) in which tumour cells have already invaded the embryo. Images D to G are confocal microscopy images of transplanted embryos at 1 dpt and 3 dpt. Normal, non-transformed pancreas transplants remain in the yolk and cells never migrate or spread in the embryo (D and F). In contrast, tumour transplants show metastatic behaviour (E and G). Some of the cell masses are marked with arrows, including one formed near the retina of the eye (G). On the bottom an example is shown for brain metastases of a transplanted gastric cancer (stomach tumour) in a Tg(fli1:eGFP) zebrafish 3 days after implantation(H). Cell masses are visible in the rhombencephalon (hindbrain) surrounding the otic capsule and near the gill arches (H). A colon tumour transplant shows a migrated tumour cell in the caudal vein region at 3 dpt (I). Both pictures (H and I) were taken by confocal microscopy. HE staining of representative histological sections of normal human pancreas tissue (J) and pancreatic cancer (K) are shown. Scales shown are in A-E: 300 μm; F, G: 400 μm; in H: 100 μm and in I: 20 μm. |

Histology of zebrafish embryos transplanted with a human pancreatic tumour. Transversal sections of zebrafish embryos transplanted with a primary human pancreatic tumour show the presence of micrometastases in different tissues at 3 dpt in 5 day old zebrafish. (A) The transversal section is approximately 40 μm caudal to the anterior end of the liver. The liver is circled with a thin white line and contains many tumour cells and some micrometastases. The square in the liver contains several micrometastases, of which one is depicted in higher magnification in B (fluorescence), C (DIC) and D (overlay). The upper square shows tumour cells and micrometastases around the mesonephric tubule (msn. tubule) and the mesonephric duct (msn. duct). The enlargement of the square is shown in F and J (HE staining). In both, F (white arrow) and J (black arrow) micrometastasis is indicated (high magnifications in G and H). In (E) HE staining of a transversal section approximately 24 μm rostral to the anterior start of the liver is shown and overlayed with the fluorescent image. A larger cell mass is indicated by an arrow. The same cell mass is indicated in I in which also a liver metastasis is seen. The cell mass is shown in high magnification in K (fluorescent picture) and in L (HE staining). Scales shown are A and E 1 mm, B-D, F-H and J-L 10 μm and in I: 500 μm. |
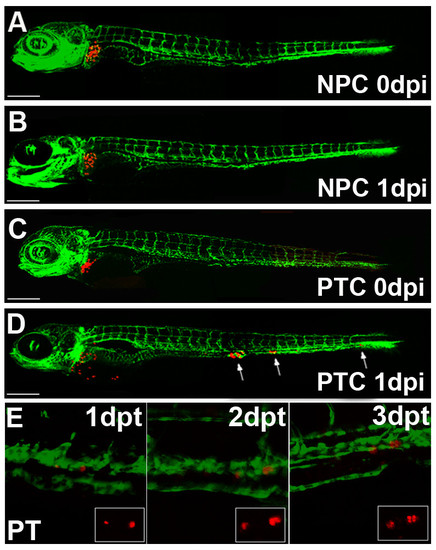
Implantation of primary human tumour cells into the zebrafish liver. (A-D) Organotopic implantation of primary tumour cells into the liver of larvae of Fli-1 zebrafish. Representative examples of zebrafish at 5 days of development injected with primary normal pancreatic cells (NPC) and with primary dissociated pancreatic tumour cells (A and C, respectively) are shown. The same fish are depicted at 1 day post injection (1 dpi). While normal pancreatic cells remained at the site of implantation in the liver (B), pancreatic tumour cells invaded the embryo and formed distant metastases, indicated with arrows (D). Scales indicated are: A-D 300 μm. Individuals were followed for up to 7 dpi and untransformed control cells never invaded the host embryos and remained in the liver for the entire observation period (data not shown). Image E shows an example of proliferating tumour cells of a transplanted pancreatic tumour fragment on consecutive days. The single cell on the right seen at 1 day post transplantation is divided into two daughter cells on 2 dpt and four cells are visible at 3 dpt. Dual colour laser scanning confocal images of the Fli-1 zebrafish are shown and in the smaller insert the red fluorescence of the CM-Dil labelled tumour cells can be seen. |

No metastatic behaviour of implanted tumour cells in cloche mutant embryos. PaTu-T cells injected into control and cloche-/- embryos. |

PCNA staining. Whole mount immunofluorescence of a pancreatic tumour transplanted embryo. |