
- Title
-
Functional analysis of the evolutionarily conserved Cis-regulatory elements on the Sox17 gene in zebrafish
- Authors
- Chan, T.M., Chao, C.H., Wang, H.D., Yu, Y.J., and Yuh, C.H.
- Source
- Full text @ Dev. Biol.
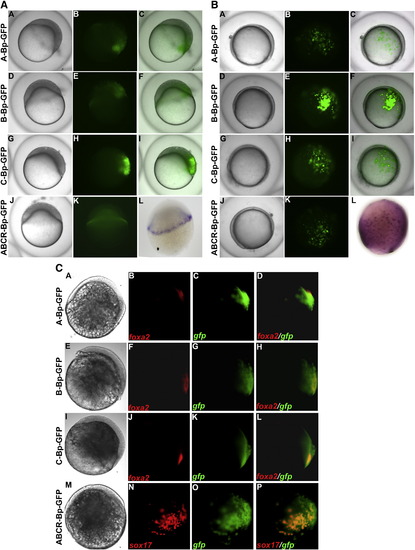
(A) GFP expression patterns of different cis-element constructs during late blastula stage. The injected embryos were collected at 5 hpf for GFP visualization and photography. The embryos shown in lateral view with dorsal to the right. The A-Bp (A–C), B-Bp (D–F) and C-Bp (G–I) constructs show strong GFP expression in half of the embryo. The ABCR-Bp (J–K) construct shows strong GFP expression in the mesendoderm lineage. (A, D, G, J). The first column is a bright field image, the second column is green fluorescence and third column is a merged picture. (L) Endogenous sox17 expression pattern at 5 hpf. (B) Embryos injected with sox17 constructs have different GFP expression patterns during the gastrula stage. The injected embryos were collected at 8 hpf for GFP visualization and photography. The embryos were shown in lateral view with dorsal to the right. The A-Bp (A–C), B-Bp (D–F) and C-Bp (G–I) constructs show strong GFP expression in half of the embryo. The ABCR-Bp (J–K) construct shows strong GFP expression (A, D, G, J). The first column is a bright field image, the second column is green fluorescence and the third column is a merged picture. (L) Endogenous sox17 expression pattern at 8 hpf. (C) Double fluorescent in situ hybridization for egfp and endogenous genes The expression pattern for A-Bp-GFP (A–D), B-Bp-GFP (E–H), C-Bp-GFP (I–L), and ABCR-Bp-GFP (M–P) are obtained from embryos at 6 hpf. The egfp mRNA are indicated as green (C, G, K and O), foxa2 (B, F and J) and sox17 (N) mRNA are shown as red. The merged image (D, H, L and P) indicated the co-localization of egfp with endogenous foxa2 or sox17 at endoderm cells. |
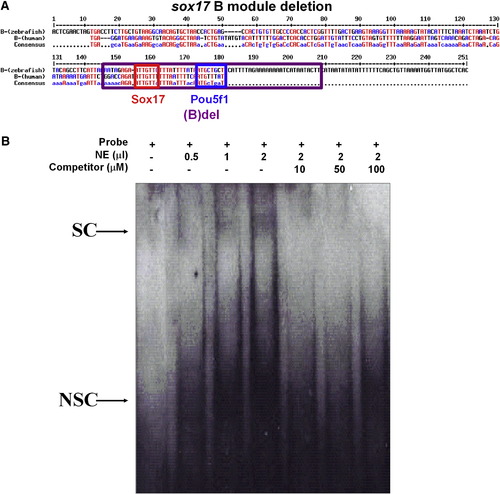
Electrophoretic mobility shift assays of pou5f1 binding site on the sox17 cis-element module B. (A) The sequence of the B module, the red line indicated the probe for the binding assay. Red line indicated the sequence for making a probe. (B) A different amount of nuclear extract (0.5, 1 and 2 μl) was added into each reaction as indicated. A different amount of specific competitors (10, 50 and 100 μM) was added into the reaction as indicated. Two complexes were detected when the probe was added into nuclear extracts (NE). The upper band can be specifically competed with a specific competitor but not with a non-specific competitor that was denoted as “S”. The “NS” indicates the lower band, which is non-specific because it can be competed with both specific and non-specific competitors. |
Reprinted from Developmental Biology, 326(2), Chan, T.M., Chao, C.H., Wang, H.D., Yu, Y.J., and Yuh, C.H., Functional analysis of the evolutionarily conserved Cis-regulatory elements on the Sox17 gene in zebrafish, 456-470, Copyright (2009) with permission from Elsevier. Full text @ Dev. Biol.