
- Title
-
Transgenic analysis of the anterior eye-specific enhancers of the zebrafish gelsolin-like 1 (gsnl1) gene
- Authors
- Yoshikawa, S., Norcom, E., Nakamura, H., Yee, R.W., and Zhao, X.C.
- Source
- Full text @ Dev. Dyn.
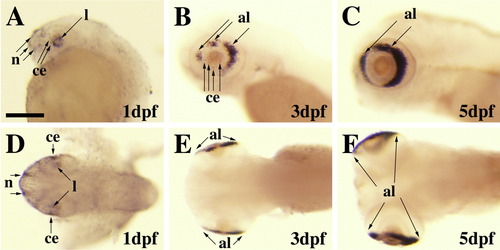
Expression of gsnl1 in zebrafish embryos detected by whole-mount in situ hybridization. A-C: Lateral view. D-F: Dorsal view. A,D: On 1 day postfertilization (dpf) embryos, gsnl1 was expressed in the lens, future corneal epithelium, and at the nose. B,E: At 3 dpf. C,F: At 5 dpf. At later stages, a strong signal in the annular ligament and a weak signal in patches in the central cornea were detected in the eye. The staining in the lens and nose was not detected at 5 dpf. Al, annular ligament; ce, corneal epithelium; l, lens; n, nose. Scale bar = 200 μm. |
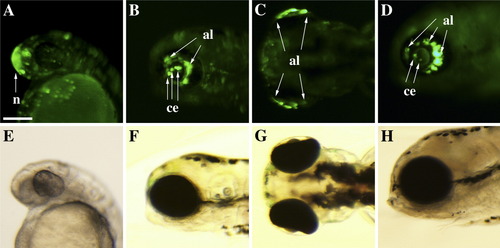
Transient transgenic expression of the gsnl1 6.4-kb reporter in zebrafish embryos. A-D: Green fluorescent protein (GFP) expression. E-H: Brightfield images. A,E: On 1 days postfertilization (dpf), GFP was detected at the nose like the endogenous gsnl1 expression, but a specific signal was not detected in the lens or the future cornea. B,C,F,G: Lateral view (B,C) and dorsal view (C,G) of 3-dpf embryos. D,H: The 5-dpf embryos. At later stages (B-D,F-H), the annular ligament and a subpopulation of the corneal epithelium were GFP-positive. The transgenic expression between 3-5 days was localized in the anterior segment of the eye, which was consistent with the endogenous gsnl1 expression pattern shown in Figure 1. al, annular ligament; ce, corneal epithelium; n, nose. Scale bar = 200 μm. |
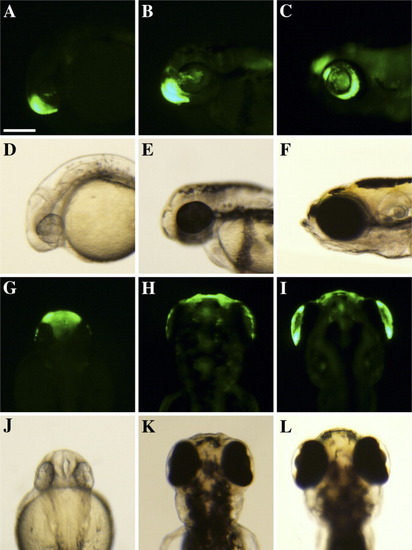
Green fluorescent protein (GFP) expression of the gsnl1 6.4-kb reporter in stable transgenic embryos. A-F: Lateral view of GFP (A-C) and brightfield images (D-F). G-L: Dorsal view of GFP (G-I) and bright field images (J-L). A,D,G,J: The 1 dpf embryos showed GFP expression in the nose region, which was primarily localized at the nasal pit and in a subpopulation of the head mesenchyme cells at the most anterior part. B,E,H,K: On 3 dpf embryos, the strong GFP signal was detected in the nose and the weak signal was observed on the future cornea in a mosaic pattern. C,F,I,L: The GFP signal was detected in the annular ligament of the eye and in the corneal epithelium in patches on 5-dpf embryos. Scale bar = 200 μm. |
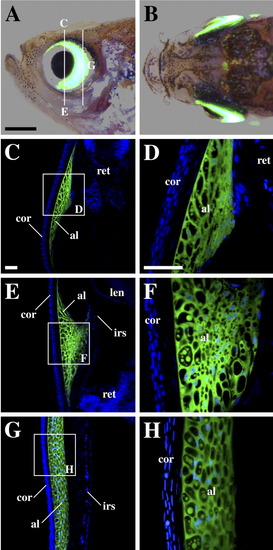
The green fluorescent protein (GFP) expression in 3-month-old stable transgenic fish of gsnl1. A,B: Merged images of whole-mount GFP fluorescence and brightfield microscopy. A: Lateral view. The white lines indicate the positions of sections C-H. B: Dorsal view. The GFP expression was detected in the anterior segment of the eye. C-H: Laser-scanning confocal microscopic images of the transverse sections at the iridocorneal angle. Green, GFP. Blue, nuclear staining by 4′,6-diamidine-2-phenylidole-dihydrochloride (DAPI). C,D: Dorsal region. E,F: Ventral region. G,H: Temporal region. The GFP signal was detected in the annular ligament, a specific connective tissue at the iridocorneal angle. Boxes in C,E,G indicate the positions of the high magnification images of D,F,H, respectively. al, annular ligament; cor, cornea; irs, iris; len, lens; ret, retina. Scale bar = 1 mm in A; 50 μm in C,D. |
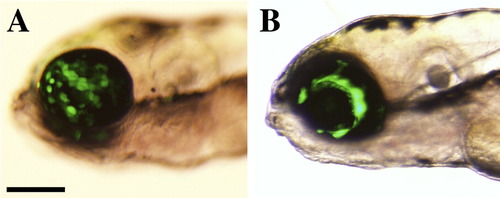
Transient transgenic expression of green fluorescent protein (GFP) controlled by the tissue-specific enhancers. A: Typical expression pattern of GFP in the embryo injected with the corneal epithelium (CE) -specific enhancer D4 in Figure 9. B: The embryo injected with the AL-enhancer D2. The GFP fluorescence and the brightfield images were taken at 5 days postfertilization (dpf) and merged. Scale bar = 200 μm. |