
- Title
-
Divergent evolution of the vertebrate polysialyltransferase Stx and Pst genes revealed by fish-to-mammal comparison
- Authors
- Marx, M., Rivera-Milla, E., Stummeyer, K., Gerardy-Schahn, R., and Bastmeyer, M.
- Source
- Full text @ Dev. Biol.
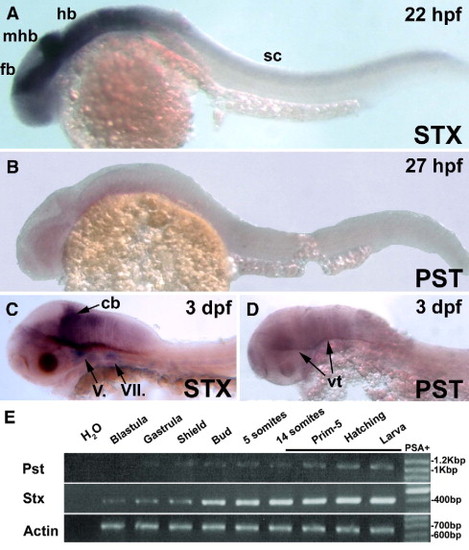
Expression of zebrafish polysialyltransferases Stx and Pst during the first 3 days of development. At 22 hpf, Stx is transcribed in all structures of the central nervous system (A) whereas Pst not detectable at 27 hpf (B). At 3 dpf, the expression of Stx remains strong in the cerebellum and motor nuclei (C), whereas a weak Pst signal becomes visible in brain regions close to the ventricles (arrows in panel D). RT-PCR analysis on developing zebrafish cDNAs reveals a weaker and later transcription of Pst compared to the expression of Stx mRNA (E). Target amplifications were based on exon-specific primers. Actin reactions were conducted using a 1:10 template dilution. The detection of PSA in developing embryos starts around 17 hpf as indicated by a PSA + bar. A–D lateral views, anterior to the left. cb, cerebellum; hb, hindbrain; fb, forebrain; mhb, midbrain–hindbrain boundary; sc, spinal cord; V., trigeminal nucleus; VII., facial nucleus. EXPRESSION / LABELING:
|
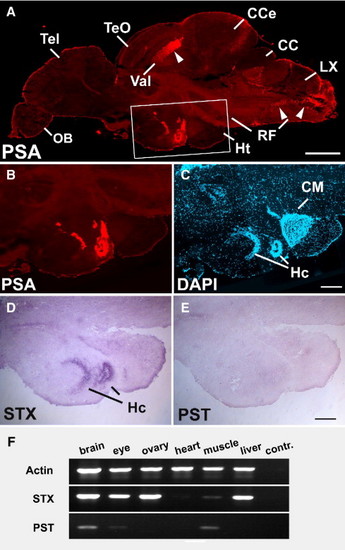
Expression of PSA and zebrafish polysialyltransferase mRNAs in the adult brain. (A) Sagittal section of an adult brain, stained for PSA. Boxed region in A is enlarged in B–E. (B–E) PSA is expressed in periventricular regions of the hypothalamus (B) on cell bodies (C, nuclear stain). Only Stx is found in the Hc (D) whereas Pst is not detectable (E). (F) RT-PCR analysis on adult tissue cDNAs reveals expression of Stx in all tissues except for heart and skeletal muscle. Pst expression is evident in brain and skeletal muscle. Target amplifications were performed as described in Fig. 2. cc, crista cerebellaris; Cce, corpus cerebelli; CM, corpus mamillare; Hc, caudal zone of periventricular hypothalamus; Ht, hypothalamus; LX, vagal lobe; OB, bulbus olfactorius; RF, reticular formation; Tel, telencephalon; TeO, tectum opticum; Val, valvula cerebelli. Scale bars 500 µm (A); 200 μm (B-E). EXPRESSION / LABELING:
|
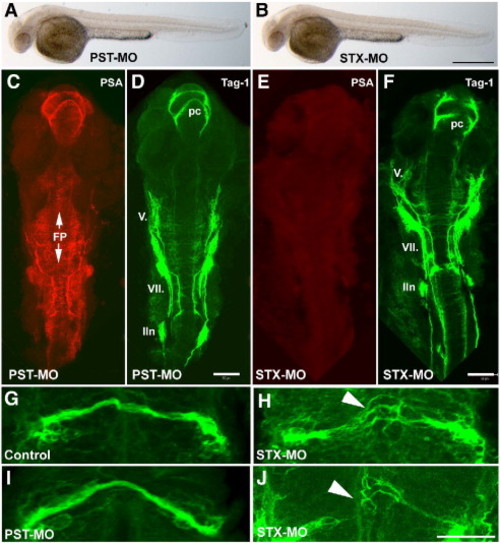
Knockdown of Stx produces abnormal axonal growth and guidance in developing zebrafish. (A, B) Embryos at 32 hpf injected with PST- (A) or STX-specific (B) morpholinos do not show any evident phenotype defects or increases in the rate of mortality. (C–F) Embryos at 32 hpf after morpholino knockdown of polysialyltransferases Stx and Pst immunolabeled for PSA (mab 735, red) and the axonal marker Tag-1 (in green). (C, D) Knockdown of Pst neither alters PSA immunoreactivity nor the growth pattern of axons. PSA is expressed by cells in the CNS, the floorplate, on axons and nuclei of cranial nerves V. and VII., and on axons of the posterior commissure (pc). (E,F) Knockdown of Stx leads to a complete loss of PSA-immunoreactivity (E), whereas the overall development is not severely disturbed (F). (G–J) Growth pattern of pc in control (G) and in PST-MO embryos (I), axons of the pc grow in a fasciculated bundle. After Stx knockdown, the PC splits into several bundles (H, arrowhead), or axons do not cross the midline (J, arrowhead). FP, floorplate; lln, lateral line nerve; pc, posterior commissure; V., trigeminal nuclei and axons; VII., facial nuclei and axons. Images in C–J are projections of confocal images, rostral to the top. Scale bars: 500 μm (A–B), 50 μm (C–F), 20 μm (G–J). PHENOTYPE:
|
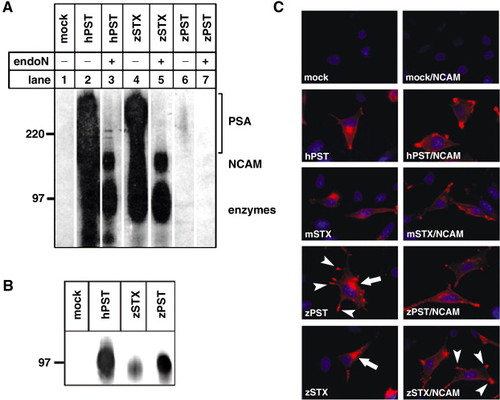
The divergent zebrafish Pst polysialyltranferase shows a low affinity for NCAM and autopolysialisation in vitro. (A) Sepharose fixed Protein A-fusion proteins of zebrafish Pst and Stx were analyzed in vitro for NCAM polysialylation. The radiolabelled reaction products were analyzed by SDS-PAGE and autoradiography before (-) and after (+) treatment with endoN. Depolysialylated Protein A fusion proteins of enzymes and NCAM are indicated. Under these conditions only zebrafish Stx is able to polysialylate NCAM to the same amount as the control, hamster Pst. (B) The western blot immunostained with anti-Protein A mouse IgG demonstrates that loading of beads with recombinant protein A-polysialyltransferases was comparable in all reaction mixtures. (C) In vivo activity of zebrafish polysialyltransferases using NCAM- and polysialyltransferase-negative LM-TK cells. Cells were analyzed for PSA expression by immunoflourescence using anti-PSA mAb 735 (red). Nuclei were visualized by Hoechst staining (blue). Cells transfected either with an empty vector or solely with NCAM do not express PSA (mock, mock-NCAM). The expression of one polysialyltransferase (zPST, zSTX), either alone or in co-transfection with NCAM, leads to a strong PSA signal comparable to the positive controls (hPST, mSTX). In cells expressing solely one polysialyltransferase, the golgi apparatus (arrows) is labelled for PSA, whereas co-expression with NCAM leads to an additional labelling of the cell membrane (arrowheads). An exception is cells transfected with zebrafish Pst alone, that reveal expression of PSA in both structures. |
Reprinted from Developmental Biology, 306(2), Marx, M., Rivera-Milla, E., Stummeyer, K., Gerardy-Schahn, R., and Bastmeyer, M., Divergent evolution of the vertebrate polysialyltransferase Stx and Pst genes revealed by fish-to-mammal comparison, 560-571, Copyright (2007) with permission from Elsevier. Full text @ Dev. Biol.