
- Title
-
Fast Release Clones: A High Throughput Expression Analysis
- Authors
- Thisse, B., Thisse, C.
- Source
- Submitted By
- Hartmeyer, Aline, Thisse, Bernard, Thisse, Christine (Citing this work)
- Protocol
- Thisse in situ hybridization protocol
- Probe
- IMAGE:7158960 Quality:
- Supplier

no expression EXPRESSION / LABELING:
|


Fig. 2 adaxial cells EXPRESSION / LABELING:
|


Fig. 3 adaxial cells, somites (stronger at myotome borders) EXPRESSION / LABELING:
|


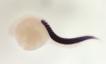
Fig. 4 adaxial cells, somites (stronger at myotome borders) EXPRESSION / LABELING:
|


Fig. 5 myotomes (stronger at myotome borders no labeling in myoseptum) |
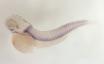

Fig. 6 myotomes (stronger at myotome borders no labeling in myoseptum), border of head muscles |


Fig. 7
myotomes (stronger at myotome borders no labeling in myoseptum), border of head muscles EXPRESSION / LABELING:
|