
- Title
-
Fast Release Clones: A High Throughput Expression Analysis
- Authors
- Thisse, B., Thisse, C.
- Source
- Submitted By
- Hartmeyer, Aline, Thisse, Bernard, Thisse, Christine (Citing this work)
- Protocol
- Thisse in situ hybridization protocol
- Probe
- MGC:92046 Quality:
- Supplier


Fig. 1 weak in notochord EXPRESSION / LABELING:
|


Fig. 2 weak in notochord EXPRESSION / LABELING:
|


Fig. 3 weak in spinal chord neurons EXPRESSION / LABELING:
|


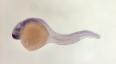
Fig. 4 CNS marginal zone stronger in telencephalon, olfactory placodes, weak in pronephric ducts EXPRESSION / LABELING:
|


Fig. 5 CNS marginal zone, pronephric ducts, nose |


Fig. 6 ganglion cell layer of retina, CNS marginal zone, pronephric ducts, nose |