
- Title
-
Visualizing normal and defective bone development in zebrafish embryos using the fluorescent chromophore calcein
- Authors
- Du, S., Frenkel, V., Kindschi, G., and Zohar, Y.
- Source
- Full text @ Dev. Biol.

Visualization of calcified skeletal structures in developing zebrafish embryos at 5, 6, 7, 9, 11, 14, 16, and 21 dpf by calcein staining. (A, B) Ventral view of the head skeleton of day-7 (A) and -11 (B) embryos labeled with calcein. m, Meckel’s cartilage; pq, palatoquadrate; e, ethmoid plate. (C, D) Side view of the head skeleton of day-7 (A) and -11 (B) embryos labeled with calcein. n, notochord; c, cleitrum. |
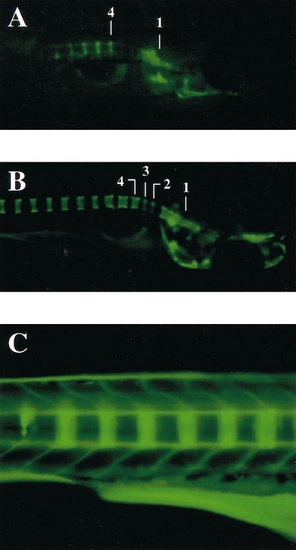
Visualization of calcified axial skeletal structures in developing zebrafish embryos. (A, B) Embryos at 8 and 9 dpf, respectively, showing that calcification of vertebrae number 4 appears earlier than vertebrae numbers 2 and 3. Vertebrae 1, 2, 3, and 4 are indicated. (C) Embryos at 9 dpf, showing the calcification initiation site of the vertebrae, which commences at the boundaries of each segment. |
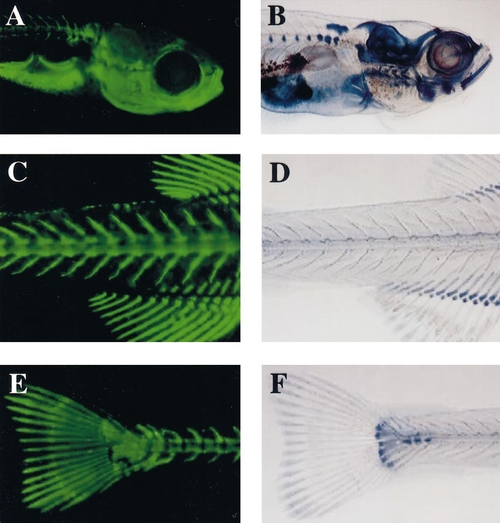
Comparison of calcein staining with Alcian blue staining. (A, C, E) Calcein labeling of calcified structures in the head, trunk, and tail regions of a 23-dpf embryo. (B, D, F) Alcian blue staining in the head, trunk, and tail regions of a 23-dpf embryo. |

Effects of ectopic expression of BMP2 in notochord cells on the skeletal development of zebrafish embryos. (A, C, E) Control embryos at 15 (A) and 24 (C, E) dpf. (B, D, F) twhh-BMP2-injected embryos of 15 (B) and 24 (D, F) dpf. The affected regions are indicated by arrows. |
Reprinted from Developmental Biology, 238(2), Du, S., Frenkel, V., Kindschi, G., and Zohar, Y., Visualizing normal and defective bone development in zebrafish embryos using the fluorescent chromophore calcein, 239-246, Copyright (2001) with permission from Elsevier. Full text @ Dev. Biol.