
- Title
-
Expression of the zebrafish genome during embryogenesis (NIH R01 RR15402)
- Authors
- Thisse, B., Pflumio, S., Fürthauer, M., Loppin, B., Heyer, V., Degrave, A., Woehl, R., Lux, A., Steffan, T., Charbonnier, X.Q. and Thisse, C.
- Source
- Submitted By
- Loppin, Benjamin, Thisse, Bernard, Thisse, Christine (Citing this work)
- Protocol
- Thisse in situ hybridization protocol
- Probe
- cb2 Quality:
- Supplier
-
Supplier: Zebrafish International Resource Center (ZIRC) (order this)
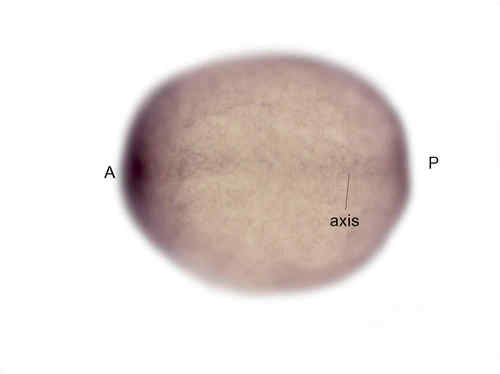
basal level of expression more intense in the axis EXPRESSION / LABELING:
|
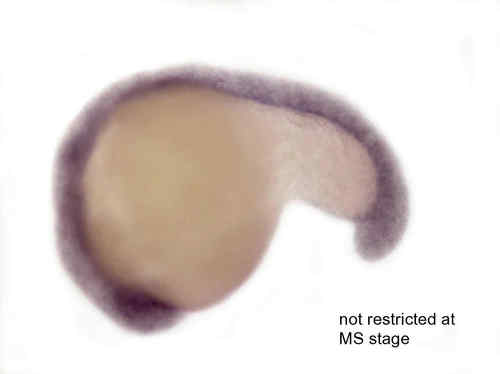
Basal level of expression. Not spatially restricted. EXPRESSION / LABELING:
|


Fig. 3 Basal level of expression but stronger at the MHB, around the eye and in the olfactory. Strong expression at the border of myotomes, weak expression in pharyngeal arches. EXPRESSION / LABELING:
|
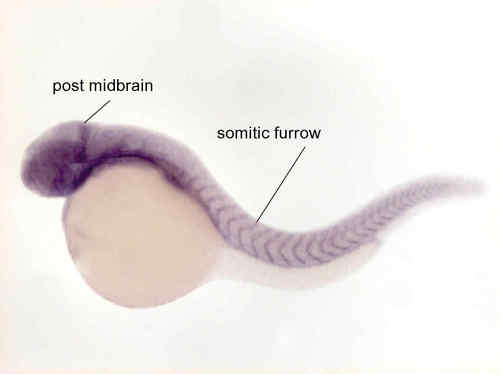
Basal level of expression but stronger in posterior midbrain, around the eye and in the olfactory. Strong expression at the border of myotomes, weak expression in pharyngeal arches. Decreasing in intensity compared to 24 hrs. |


Fig. 5 weak expression in epiphysis and in posterior midbrain |

Unillustrated author statements EXPRESSION / LABELING:
|