
Image
|
Figure Caption
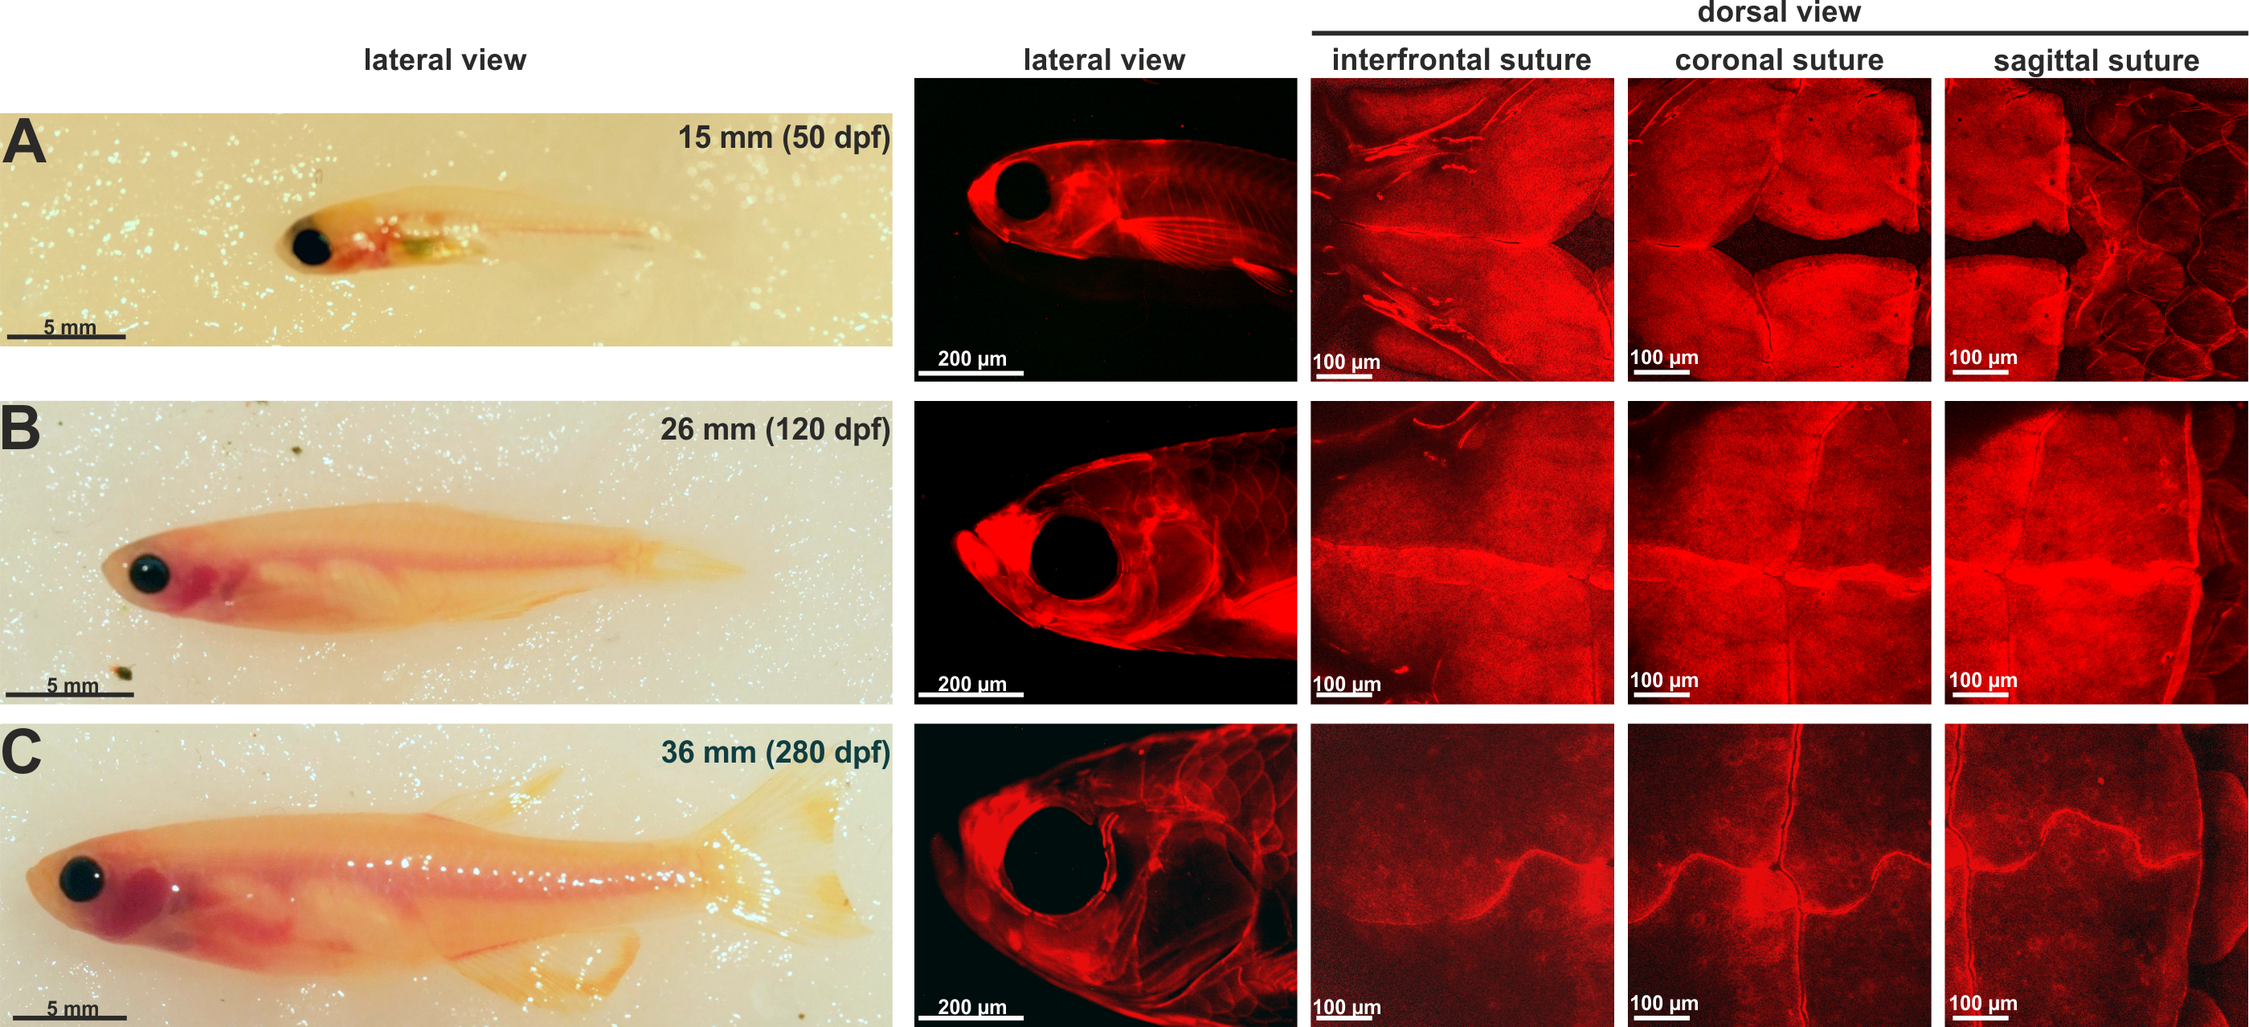
Fig. S1
Suture visualization in zebrafish.
Alizarin red staining was performed at different stages of development (A: 15 mm, 50 dpf; B: 26 mm, 120 dpf; C: 36 mm, 280 dpf/adult) and showed calvarial plate growth and progression of suture establishment over time. Dorsal views are maximum intensity Z-projections from confocal stacks.
Figure Data
Acknowledgments
This image is the copyrighted work of the attributed author or publisher, and
ZFIN has permission only to display this image to its users.
Additional permissions should be obtained from the applicable author or publisher of the image.
Full text @ PLoS One