
- Title
-
Characterization of biklf/klf17-deficient zebrafish in posterior lateral line neuromast and hatching gland development
- Authors
- Suzuki, H., Ishizaka, T., Yanagi, K., Sone, R., Sunaga, Y., Ohga, R., Kawahara, A.
- Source
- Full text @ Sci. Rep.
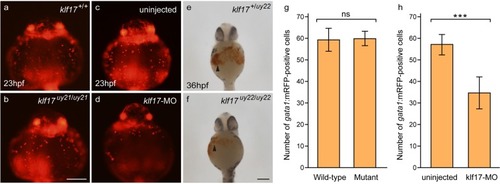
Primitive erythrocytes were observed in the PHENOTYPE:
|
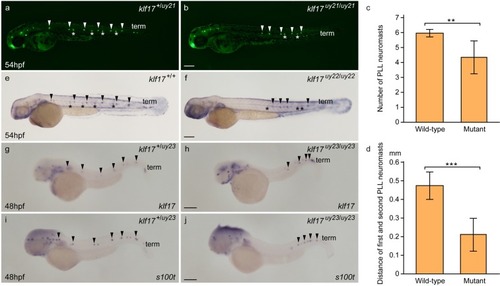
Abnormal PLL neuromast deposition in the |
PHENOTYPE:
|
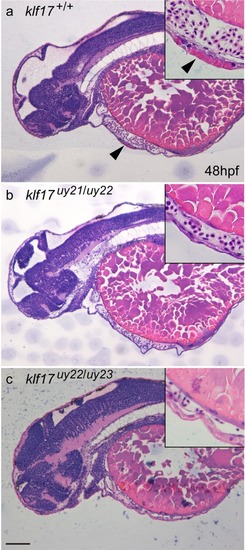
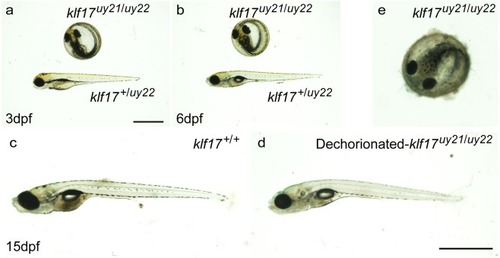
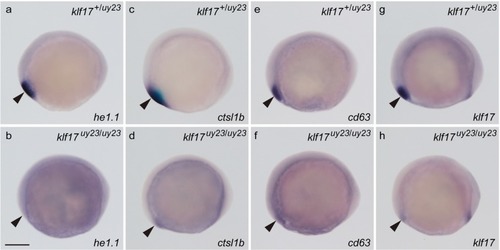
Loss of hatching gland cells in the PHENOTYPE:
|

Cathepsin l 1b protein expression in the hatching gland. The expression of Cathepsin L 1b (Ctsl1b), which is one of hatching gland enzymes, was examined using whole-mount immunohistochemistry at 25 hpf. ( |
The expression of polster genes in the |
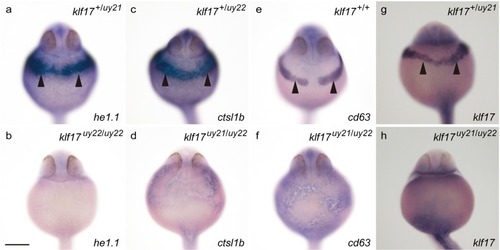
The expression of hatching gland genes in the |