FIGURE SUMMARY
Title

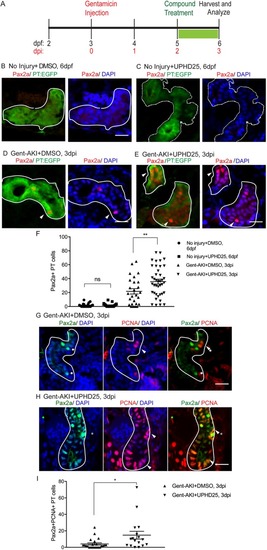
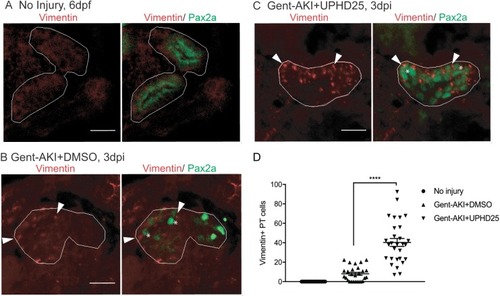
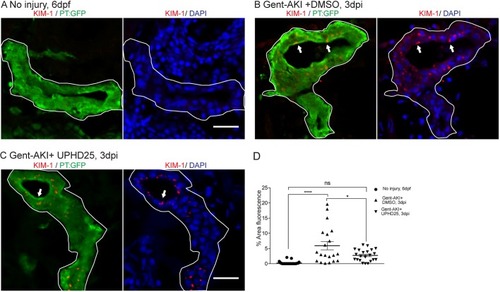
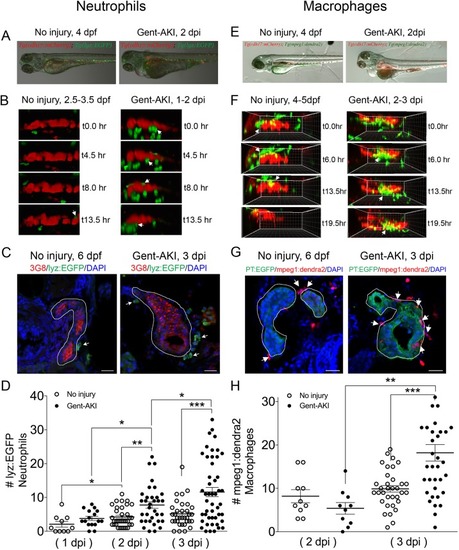
Enhancing acute kidney injury regeneration by promoting cellular dedifferentiation in zebrafish

Authors
Skvarca, L.B., Han, H.I., Espiritu, E.B., Missinato, M.A., Rochon, E.R., McDaniels, M.D., Bais, A.S., Roman, B.L., Waxman, J.S., Watkins, S.C., Davidson, A.J., Tsang, M., Hukriede, N.A.
Source
Full text @ Dis. Model. Mech.

UPHD25 treatment increases Pax2a reactivation and proliferation during AKI. (A) Experiment schematic: Tg(PT:EGFP) larvae were injected with gentamicin at 3 dpf to induce AKI (gent-AKI). At 2 dpi, gent-AKI larvae were treated with 1% DMSO or 1 μM UPHD25 for 24 h (2-3 dpi) then harvested for analysis. (B-E) Immunofluorescence staining of Pax2a (red), proximal tubule (PT; green) and nuclei (DAPI; blue) of age-matched 6 dpf no injury+DMSO (B), 6 dpf no injury+UPHD25 (C), 3 dpi gent-AKI+DMSO (D) and 3 dpi gent-AKI+UPHD25 (E) larvae. Nuclear localization of Pax2a was shown by overlaying with nuclear counterstain, DAPI (blue). PT is outlined in white and Pax2a+ RTECs are marked with arrowheads. (F) Quantification of Pax2a+ cells. MeanNoInjury+DMSO=1.561 (N= 26) vs MeanNoInjury+UPHD25=1.787 (N=21) vs MeanGent-AKI+DMSO=21.8 (N=26) vs MeanGent-AKI+UPHD25=35.79 (N=40). Data pooled from three biological replicates are shown expressed as mean±s.e.m. One-way ANOVA. (G,H) Immunofluorescence co-stain of Pax2a (green), PCNA (red) and DAPI (blue) in gent-AKI+DMSO (G) and gent-AKI+UPHD25 (H). Nuclear localization of PCNA was shown by overlaying with nuclear counterstain, DAPI (blue). Pax2a+ cells are marked with asterisks and PCNA+ are marked with arrowheads. (I) Quantification of Pax2a+ PCNA+ cells. MeanGent-AKI+UPHD25=4.08 (N=23) vs MeanGent-AKI+UPHD25=14.74 (N=17). Data pooled from three biological replicates are shown expressed as mean±s.e.m. Two-tailed t-test: *P<0.05, **P<0.01, ns, not significant. Scale bars: 20 μm.

UPHD25 treatment increases dedifferentiation during AKI. (A-C) Immunofluorescence co-stain of Vimentin (red; cytosolic) and Pax2a (green) in PT of age-matched 6-dpf no injury (A), 3 dpi gent-AKI+DMSO (B) and 3 dpi gent-AKI+UPHD25 (C) fish. (D) Quantification of Vimentin+ RTECs. MeanNoInjury+UPHD25=0 (N=22) vs MeanGent-AKI+DMSO=8.00 (N=27) vs MeanGent-AKI+UPHD25=40.31 (N=29). Pax2a+ cells are marked with asterisks and Vimentin+ RTECs are marked with arrowheads. PT is outlined in white. Data pooled from three biological replicates are shown expressed as mean±s.e.m. One-way ANOVA: ****P<0.001. Scale bars: 20 μm.

UPHD25 treatment decreases Kim-1 expression level after AKI. (A) Immunofluorescence of Kim-1 expression in 6 dpf uninjured (A), 3 dpi gent-AKI +DMSO (B) and 3 dpi gent-AKI +UPHD25 (C) larvae. Apical localization of Kim-1 was shown by overlaying with nuclear counterstain, DAPI (blue). Histological sectioning poses a challenge of obtaining a perpendicular transversal cut to observe Kim-1 apical localization. (C) Shows an ideal perpendicular transversal section to observe apical expression of Kim-1. PTs are outlined in white and RTECs with Kim-1 expression are marked with arrows. (D) Quantification of Kim-1 was acquired via measuring the area of Kim-1 expression in PTs. MeanNoInjury=0.22 (N=29) vs MeanGent-AKI+DMSO=5.92 (N=20) vs MeanGent-AKI+UPHD25=2.71 (N=22). Data pooled from three biological replicates are shown expressed as mean±s.e.m. One-way ANOVA: *P<0.05, ****P<0.001, ns, not significant. Scale bars: 20 μm.

Neutrophil and macrophage populations change in the kidney field after AKI. (A-D) Tg(cdh17:mCherry); Tg(lyz:EGFP) transgenic zebrafish were used for neutrophil analyses. (E-H) Tg(cdh17:mCherry); Tg(mpeg1;dendra2) transgenic zebrafish were used for macrophage analyses. (A,E) Transgenic lines were injected with gentamicin at 3 dpf and imaged at 2 dpi. (B,F) Snapshots of live imaging of lyz+ neutrophils imaged at 1 dpi for 13.5 h (B) and mpeg1+ macrophages imaged at 2 dpi for 19.5 h (F) in a no-injury and gent-AKI setting. Arrows indicate neutrophils or macrophages adjacent to PTs. (C,G) Immunofluorescence co-stain of PTs (red or green) and neutrophils (green) (C) or macrophages (red) (G) in no-injury and gent-AKI at 3 dpi. PTs are outlined in white and adjacent leukocytes are marked with arrows. (D,H) Quantification of neutrophil (D) and macrophage (H) numbers adjacent to the PT before and after injury. MeanNoInjury5dpf=4.24 (N=34) vs Mean2dpi=7.76 (N=34) vs MeanNoInjury6dpf=5.15 (N=34) vs Mean3dpi=11.60 (N=48). Adjacent leukocytes were counted for both no injury and gent-AKI at 1, 2 and 3 dpi (D), and 2 and 3 dpi (H). Data pooled from three biological replicates are shown expressed as mean±s.e.m. One-way ANOVA: *P<0.05, **P<0.01, ***P<0.005. Scale bars: 20 μm.

UPHD25 treatment has no effect on neutrophil response but lowers total macrophage recruitment during early AKI phase. (A,C) Tg(cdh17:mCherry); Tg(lyz:EGFP) transgenic zebrafish were used for neutrophil analyses. (B,D) Tg(cdh17:mCherry); Tg(mpeg1;dendra2) transgenic zebrafish were used for macrophage analyses. (A,B) Immunofluorescence co-stain of PTs (red or green) and neutrophils (green) (A) and macrophages (red) (B) in gent-AKI+DMSO and gent-AKI +UPHD25. PTs are outlined in white and leukocytes are marked with arrows. (C) Quantification of neutrophil numbers showed no significance between DMSO and UPHD25 treatment groups. (D) Quantification of macrophage numbers showed a significant decrease in macrophage numbers in UPHD25 treatment group. MeanGent-AKI+DMSO=16.38 (N=69) vs MeanGent-AKI+UPHD25=12.99 (N=75). Data pooled from three biological replicates are shown expressed as mean±s.e.m. Two-tailed t-test: *P<0.05, ns, not significant. Scale bars: 20 μm.

UPHD25 treatment reduces total M1 macrophage population, but not M2 macrophage population.Tg(mpeg1:dendra2); Tg(PT:EGFP) transgenic zebrafish were used for macrophage polarization analysis. (A,B) Immunofluorescence co-stain of TNFα (red), macrophages (blue) and PT (green) in gent-AKI+DMSO (A) and gent-AKI+UPHD25 (B). PTs are outlined in white. TNFα+/mpeg+ are marked with an asterisk and TNFα−/mpeg1+ are marked with an arrow. (C) Quantification of M1 macrophage recruitment by counting TNFα+/mpeg1+ cells adjacent to the PT. MeanGent-AKI+DMSO=0.38 (N=26) vs MeanGent-AKI+UPHD25=0.15 (N=28). (D,E) Immunofluorescence co-stain of arginase-2 (red), macrophages (blue) and PT (green) in gent-AKI+DMSO (D) and gent-AKI+UPHD25 (E). Arg2+/mpeg1+ are marked with an asterisk. (F) Quantification of M2 macrophage recruitment by counting Arg-2+/mpeg1+ cells adjacent to the PT. MeanGent-AKI+DMSO=0.61 (N=26) vs MeanGent-AKI+UPHD25=0.62 (N=27). Macrophage numbers were normalized by calculating the ratio of M1 or M2 over total macrophages; i.e. (TNFα+/mpeg1+)/total mpeg1+. Data pooled from three biological replicates are shown expressed as mean±s.e.m. Two-tailed t-test: **P<0.01, ns, not significant. Scale bars: 20 μm.

UPHD25 treatment efficacy requires intact RA signaling.Tg(PT:EGFP) transgenic zebrafish were used to analyze RTEC proliferation. (A-D) Immunofluorescence stain showing cells actively undergoing S-phase marked with PCNA antibody (red) and PT (green) in gent-AKI+DMSO (A), gent-AKI+Ro41 (B), gent-AKI+UPHD25 (C) and gent-AKI+Ro41+UPHD25 (D). PTs are outlined in white and arrows mark PCNA+ RTECs. (E) Quantification of PCNA+ RTECs in each treatment group. MeanUPHD25=17.56 (N=34) vs MeanRo41+UPHD25=8.15 (N=34). Data pooled from three biological replicates are shown expressed as mean±s.e.m. One-way ANOVA: ****P<0.001. Scale bars: 20 μm.

ZFIN is incorporating published figure images and captions as part of an ongoing project. Figures from some publications have not yet been curated, or are not available for display because of copyright restrictions.

ZFIN is incorporating published figure images and captions as part of an ongoing project. Figures from some publications have not yet been curated, or are not available for display because of copyright restrictions.

Acknowledgments
This image is the copyrighted work of the attributed author or publisher, and ZFIN has permission only to display this image to its users. Additional permissions should be obtained from the applicable author or publisher of the image. Full text @ Dis. Model. Mech.