
FIGURE SUMMARY
- Title
-
Axially-confined in vivo single-cell labeling by primed conversion using blue and red lasers with conventional confocal microscopes
- Authors
- Taniguchi, A., Kimura, Y., Mori, I., Nonaka, S., Higashijima, S.I.
- Source
- Full text @ Dev. Growth Diff.
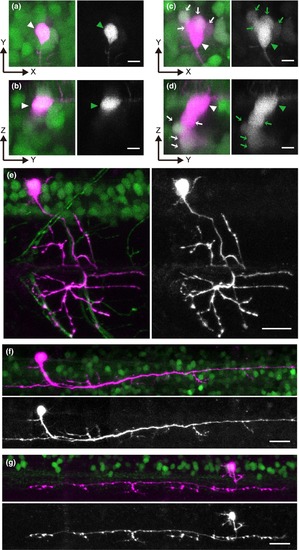
Spatially confined primed conversion enables individual neuron labeling in tightly packed neural clusters in living larval zebrafish. Photoconversion experiments were performed in the spinal cords of 3‐to‐4‐dpf larvae expressing Dendra2. (a‐d) Photoconversion of Dendra2 in Tg[HuC:Gal4]; Tg[UAS:Dendra2] with primed conversion (a and b) or conventional 405 nm illumination (c and d). (a and c) are stacked images of the X‐Y dimension, while (b and d) are stacked images of the X‐Z dimension. In each image, the left panel shows both green and red channels (red channel is shown in magenta), while the right panel shows only the red channel (shown in black‐and‐white). The primed conversion successfully highlights only the targeted cell (arrowheads in a and b). In contrast, with 405nm‐illumination, not only the targeted cell (arrowheads in c and d) but also cells located nearby (primarily those located in the Z dimension) express red Dendra2 (arrows in c and d). (e) Photoconversion of Dendra2 in Tg[vachta‐hs:Gal4]; Tg[UAS:Dendra2] with primed conversion. The morphology of an individual trunk motoneuron is clearly revealed in its entirety. (f) Photoconversion of Dendra2 in Tg[chx10:Gal4]; Tg[UAS:Dendra2] with a primed conversion. The morphology of an individual chx10‐positive neuron (a neuron whose axon descends on the same side of the spinal cord; Kimura et al., 2006) is clearly revealed. (g) Photoconversion of Dendra2 in Tg[eng1b‐hs:Gal4]; Tg[UAS:Dendra2] with primed conversion. The morphology of an individual eng1b‐positive neuron (a neuron whose axon ascends on the same side of the spinal cord; Higashijima et al., 2004a) is clearly revealed. Scale bars: 5 μm in a–d; 20 μm in e–g.
|
Acknowledgments
This image is the copyrighted work of the attributed author or publisher, and
ZFIN has permission only to display this image to its users.
Additional permissions should be obtained from the applicable author or publisher of the image.
Full text @ Dev. Growth Diff.