
- Title
-
The kinetochore protein, CENPF, is mutated in human ciliopathy and microcephaly phenotypes
- Authors
- Waters, A.M., Asfahani, R., Carroll, P., Bicknell, L., Lescai, F., Bright, A., Chanudet, E., Brooks, A., Christou-Savina, S., Osman, G., Walsh, P., Bacchelli, C., Chapgier, A., Vernay, B., Bader, D.M., Deshpande, C., O' Sullivan, M., Ocaka, L., Stanescu, H., Stewart, H.S., Hildebrandt, F., Otto, E., Johnson, C.A., Szymanska, K., Katsanis, N., Davis, E., Kleta, R., Hubank, M., Doxsey, S., Jackson, A., Stupka, E., Winey, M., Beales, P.L.
- Source
- Full text @ J. Med. Genet.
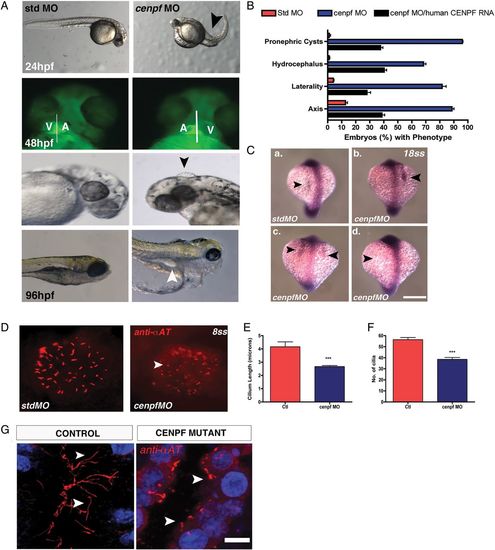
(A) Zebrafish cenpf morphants display increased body axis curvature at 24 h postfertilisation (hpf) compared with control embryos (black arrow). Cenpf knockdown in cardiac myosin light chain (cmlc2)-gfp transgenic zebrafish causes laterality heart defects at 48 hpf. Hydrocephalus (arrow) is evident at 72 hpf in cenpf morphants compared with control embryos. At 96 hpf, pronephric cysts (arrow) are evident in cenpf morphants compared with control embryos. (B) Quantitative graph showing increased occurrence of axis curvature defects, laterality malformations, hydrocephalus and pronephric cysts in cenpf morphants (blue bars) compared with control embryos (red bars) and compared with cenpf morphants injected with human CENPF RNA (black bars). Bars represent an average of three experiments. Error bars denote SE of the mean (SEM). [Std-MO (n=266) % ventral axis curvature at 24 hpf vs cenpf-MO (n=173) 12.7±1.5 vs 88.7±1.4, *p<0.001; cenpf-MO (n=173) vs cenpf-MO with human CENPF RNA (n=256) 88.7±1.4 vs 38.7±2.0, *p<0.001; Std-MO (n=223) % laterality defects at 48 hpf vs cenpf-MO (n=152) 4.0±0.6 vs 81.7±2.8, *p<0.001; cenpf-MO (n=152) vs cenpf-MO with human CENPF RNA (n=229) 81.7±2.8 vs 28±2.6, ***p<0.01; Std-MO (n=204) % hydrocephalus at 72 hpf vs cenpf-MO (n=93) 1±0.6 vs 68.3±1.7, *p<0.001; cenpf-MO (n=93) vs cenpf-MO with human CENPF RNA (n=197) 68.3±1.7 vs 40.3±1.7, *p<0.001; Std-MO (n=158) % pronephric cysts at 120 hpf vs cenpf-MO (n=76) 1.2±0.9 vs 96±0.6, ****p<0.0001; cenpf-MO (n=76) vs cenpf-MO with human CENPF RNA (n=122) 96±0.6 vs 37.3±1.9, *p<0.001]. (C) Representative images of southpaw mRNA expression in the lateral plate mesoderm at 18-somites (ss) of control (a) and cenpf morphant embryos (b-d). (a) left-sided expression in control embryos (arrow, top left panel). (b) right-sided expression (arrow), (c) bilateral expression and (d) absent expression in stage-matched cenpf morphant embryos (arrows). Scale bar 50 μm. (D) Representative micrographs following immunofluorescent labelling of Kupffer's vesicle (KV) cilia with anti-α-acetylated tubulin antibody at 8 ss. Short KV cilia are noted in cenpf morphants (white arrows) (E) Quantitative graph showing a quantitative difference in KV cilia length (µm) in cenpf morphants (n=136 cilia; n=5 embryos) vs controls (SD MO) (n=228 cilia; n=4 embryos); 4.2±0.4 vs 2.6±0.1 **p<0.0001). (F) Quantitative graph showing that KV cilia number were significantly less in cenpf morphants (n=5 embryos) vs controls (std MO) (n=5 embryos); 56.4±1.9 vs 38.6±1.7 **p<0.001). (G) Long cilia are observed in the lumina of collecting ducts of control fetuses (white arrow) while short cilia are evident on renal epithelial cells of CENPF mutant fetal kidneys (white arrow). Sections are counterstained with 4′,6-diamidino-2-phenylindole. Scale bar 10 μm. MO, morpholino oligonucleotides. EXPRESSION / LABELING:
PHENOTYPE:
|

ZFIN is incorporating published figure images and captions as part of an ongoing project. Figures from some publications have not yet been curated, or are not available for display because of copyright restrictions. PHENOTYPE:
|