
- Title
-
Optogenetically enhanced pituitary corticotroph cell activity post-stress onset causes rapid organizing effects on behaviour
- Authors
- De Marco, R.J., Thiemann, T., Groneberg, A.H., Herget, U., Ryu, S.
- Source
- Full text @ Nat. Commun.
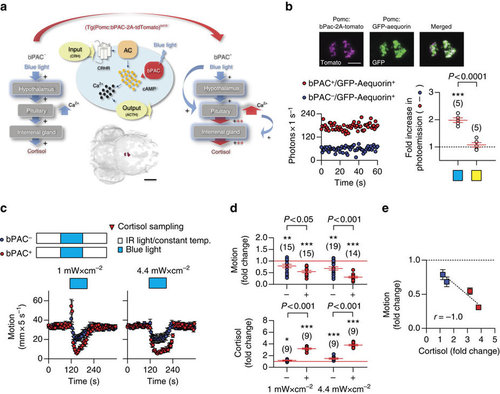
Blue-light-stimulated bPAC+ larvae show strengthened stress reactions. (a) Schematic showing the expected amplification of cAMP-dependent hypothalamic signalling and Ca2+-dependent hormone release in pituitary corticotrophs in presence of bPAC. bPAC+ larvae are expected to show an amplified level of pituitary corticotroph cell activity and subsequent cortisol release in response to blue light, as compared with bPAC- larvae. Bottom, dorsal view of bPAC expression in pituitary corticotrophs as detected by fused tdTomato fluorescence. Scale bar, 500 µm. Modified from ref. 28. (b) The Ca2+-sensitive photoprotein GFP-Aequorin is expected to produce higher Ca2+-dependent photo-emission in corticotroph cells as a result of a blue-light-dependent bPAC activation. Top, Co-expression (right) of fluorescent tdTomato (left) and GFP (center). Scale bar, 50 µm. Bottom left, Representative post-blue-light Ca2+-dependent photo-emission time curves of bPAC+/GFP-Aequorin+ and bPAC-/GFP-Aequorin+ larvae pre-incubated in the Aequorin substrate coelenterazine, whose oxidation results in photon emission. Bottom right, After a brief exposure to blue light (blue square), bPAC+/GFP-Aequorin+ larvae on average showed a twofold increase in photo-emission, that is, area under the photons s-1-time curve, as compared with bPAC-/GFP-Aequorin+. This was not the case with a yellow-light exposure (yellow square), reflecting a blue-light-dependent Ca2+ increase as a blue-light-specific response (***P<0.001 after one-sample t-tests against a fold change of ′1′ (dashed line), P value after a two-tailed t-test). (c) Top, groups and protocol for testing responses of briefly dark-adapted bPAC+ and bPAC- larvae to a squared pulse of blue light. Bottom, individual motion (mean±s.e.m., in mm per 5 s) before, during and after a squared pulse of blue light of either low (left) or high (right) power. (d) Blue-light-mediated motion (top) and cortisol (bottom) change in bPAC+ and bPAC- larvae as a function of light power. *P<0.05, **P<0.01, ***P<0.001 after one-sample t-tests against a fold change of ′1′ (red lines), P values indicate results of Bonferroni′s tests after a two-way ANOVA. (b,d) Sample size in parentheses. (e) Correlation between motion and cortisol fold change from c and d, respectively. |
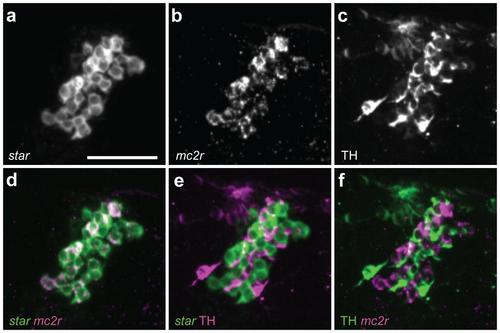
The interrenal gland in zebrafish larvae. a-c, The interrenal gland consists of steroidogenic cells expressing star (a) and the ACTH-binding mc2r (b), as shown by fluorescence in situ hybridization, and catecholaminergic chromaffin cells expressing TH (c), as shown by immunohistochemistry. d-f, The star-expressing steroidogenic cells coexpress mc2r (d), and are intermingled with the TH-expressing chromaffin cells (e), which do not co-express mc2r (f). Scale bar: 50 µm. |