
- Title
-
A family of photoswitchable NMDA receptors
- Authors
- Berlin, S., Szobota, S., Reiner, A., Carroll, E.C., Kienzler, M.A., Guyon, A., Xiao, T., Tauner, D., Isacoff, E.Y.
- Source
- Full text @ Elife
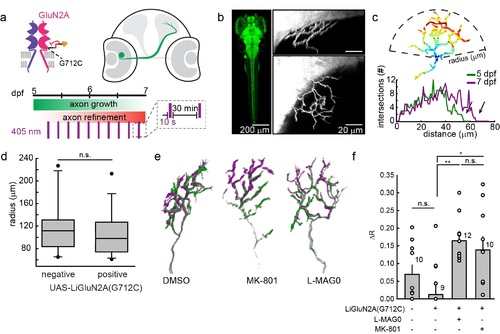
GluN2A(G712C) photo-antagonism disrupts refinement of retinal ganglion cell axon arbors in larval zebrafish in vivo.(a) Cartoons depicting GluN2A(G712C) photo-antagonism (top left), development of retinal ganglion cell projection (top, right) and timeline of the photo-antagonism assay (bottom). (b) (Left) Dorsal view of 5 dpf larva showing pan-neuronal expression pattern driven by s1101t-gal4 visualized by expression of UAS-GCaMP3. Transverse (right, top) and dorsal (right, bottom) tectal projection of a retinal ganglion cell axon arbor labeled by mosaic expression of pou4f3:mGFP at 7 dpf. (c) Axon arbors were traced and arbor radius measured by a 3-dimensional Sholl analysis counting the number of intersections encountered by concentric spheres centered on the first branch point. Arrows indicate arbor radius (R) at 5 dpf and 7 dpf. (d) Prior to antagonism, Tg[s1101t-gal4; UAS:GluN2A(G712C)] animals have a comparable distribution of arbor radii at 5 dpf as non-expressing animals (without UAS, but mix of s1101t +/-) (n.s., p >0.6, Mann-Whitney Rank Sum Test, n = 19, GluN2A(G712C)-expressing axons and 10 non-expressing axons). Box plot whiskers indicate 5% and 95% percentiles. Dots above whiskers represent outliers. (e) Representative selection of retinal ganglion cell axon arbors in transgenic animals at 5 dpf (green) and 7 dpf (magenta). Larvae were treated at 5 dpf with either 150 µM L-MAG0 in 0.3% DMSO, 0.3% DMSO alone, or 25 µM MK-801, and subjected to 10 s flashes of 405 nm light at 30 min intervals from 128-168 hpf. (f) In animals where GluN2A(G712C) was photo-antagonized by MAG, retinal ganglion cell axon arbors grew significantly more compared to DMSO-treated control groups (left-to-right: ΔR = 6.9%, n = 10 axons, ΔR = 1.2%, n = 9 axons; ΔR = 16.4%, n = 12 axons). This overgrowth was comparable to the change in arbor radius observed in animals treated with MK-801 (ΔR = 13.8%, n = 10 axons). For statistical analysis of the relative change in arbor radius (ΔR = (R7dpf-R5dpf)/R5dfp), we initially compared untreated -wt animals and untreated transgenic animals (two left bars) and observed no statistical difference (mean ± SEM, n.s. not significant, two-tailed, unpaired t-test). This enabled the comparison between the animals from the same transgenic background (second to fourth bar) for the effect of photo-inhibition on radius (mean ± SEM, n.s. not significant, **p<0.01, *p<0.05, tested with one way ANOVA, all pairwise Tukey post hoc test (see Figure 9-figure supplement 1c). Individual data points are shown for f (open circles). |