
- Title
-
Transcriptome Analysis of Chemically-Induced Sensory Neuron Ablation in Zebrafish
- Authors
- Cox, J.A., Zhang, B., Pope, H.M., Voigt, M.M.
- Source
- Full text @ PLoS One
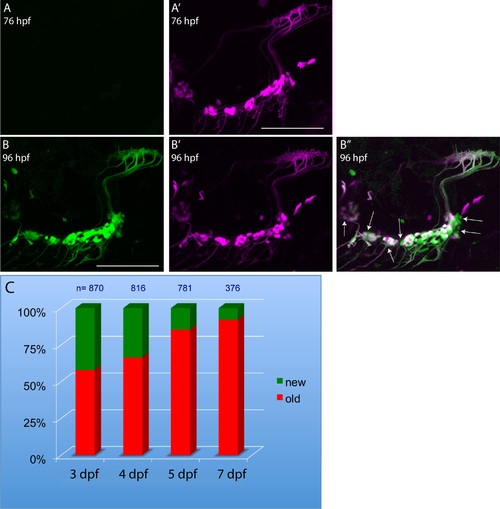
Epibranchial neurogenesis is occurring during timeframe of MET treatment. Panels A and A′ respectively, show the green and red (magenta) images of epibranchial neurons in a 76 hpf p2rx3.24.0:gal4VP16;UAS:kaede larva just after exposure to a 405nm laser: note that all kaede has been converted to red fluorescence. Panels B, B′ and B′′ show the same embryo 20 hours later in the green, magenta and combined channels, respectively. Only newly born neurons show green fluorescence alone (some of these neurons are indicated by the arrows in B′′), whereas previously existing neurons contain both photoconverted (magenta) and newly-synthesized (green) kaede. Scale bars in A′,B = 100 µm. Panel C represents the percentage of labeled neurons (total numbers counted are shown at the tops of the bars), 24 hours after photoconversion at the indicated stage, that were either green+/red- (newly born) or green+/red+ (pre-existing). |