
- Title
-
Transcriptional, post-transcriptional and chromatin-associated regulation of pri-miRNAs, pre-miRNAs and moRNAs
- Authors
- Nepal, C., Coolen, M., Hadzhiev, Y., Cussigh, D., Mydel, P., Steen, V.M., Carninci, P., Andersen, J.B., Bally-Cuif, L., Müller, F., Lenhard, B.
- Source
- Full text @ Nucleic Acids Res.
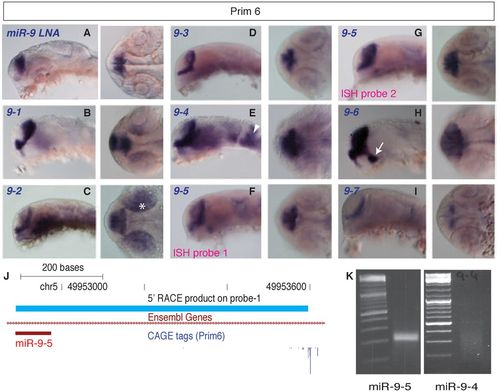
Expression pattern revealed by in situ hybridization of mature miR-9 and pri-miRNA transcripts during prim6 stage. (A) Expression pattern of mature miR-9 is mostly restricted to telencephalon. Left panels represent lateral views and right panels represent dorsal views. (B-I) Expression pattern of miR-9 pri-miRNA transcripts is also restricted to telencephalon with differences in the spatiotemporal details among different pri-miRNAs, such as: miR-9-2 (developing retina, white asterisk; Figure 2C), miR-9-4 (posterior brain regions, white arrowhead; Figure 2E) and miR-9-6 (hypothalamus, white arrow; Figure 2H). (J) Amplified region of 5′ RACE PCR product (corresponding to probe-1) of miR-9-5 maps exactly to the alternative intronic CAGE tags. (K) Unique discrete amplification band obtained from 5′ RACE PCR products obtained for miR-9-5 (with intronic CAGE tags). Multiple non-specific bands and/or a smear were obtained for miR-9-4 that did not have alternative intronic CAGE tags. EXPRESSION / LABELING:
|
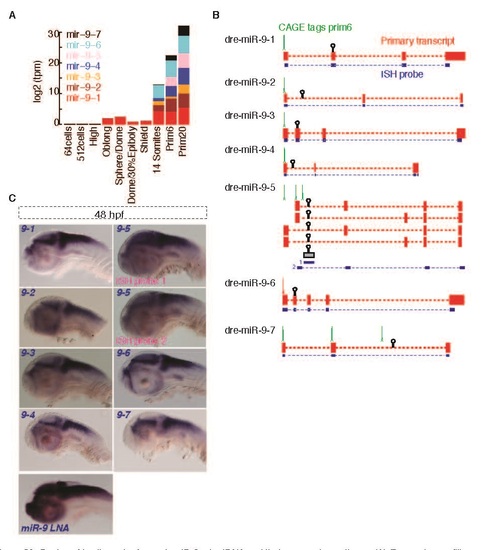
Design of in situ probe for each miR-9 pri-miRNA and their expression patterns. (A) Expression profiling of miR-9 primary transcripts determined by CAGE-seq reveals miR-9 pri-miRNAs are zygotically initiated transcripts. X-axis represents the developmental stages analyzed. Y-axis represents the expression level. Expression profiling. (B) Schema describing transcripts organization at miR-9 loci. Position of CAGE tags (prim6 stage) are indicated by a green peaks. Pre-miRNAs are represented by a small hairpin and exons of pri-miRNA transcripts are represented by rectangular red boxes. Positions of the designed ISH probes are represented by rectangular blue boxes. (C) Expression pattern of miR-9 pri-miRNA transcripts and mature miR-9 LNA probe at 48 hpf, as determined by in situ hybridization revealed using NBT/BCIP (blue) and shown in lateral views. |