- Title
-
High-Resolution Sequencing and Modeling Identifies Distinct Dynamic RNA Regulatory Strategies
- Authors
- Rabani, M., Raychowdhury, R., Jovanovic, M., Rooney, M., Stumpo, D.J., Pauli, A., Hacohen, N., Schier, A.F., Blackshear, P.J., Friedman, N., Amit, I., Regev, A.
- Source
- Full text @ Cell
|
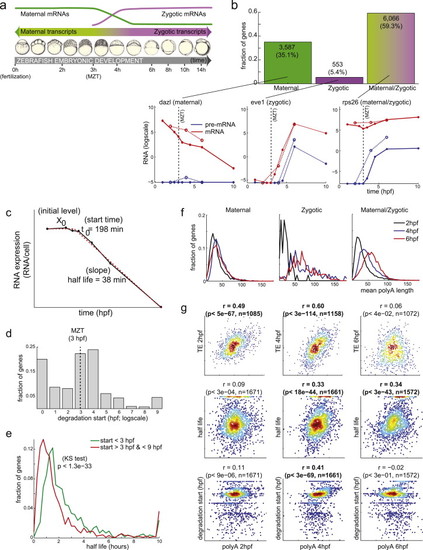
Applying DRiLL to Study the Regulation of Maternal mRNA Stability during Early Zebrafish Development Related to Figure 2. (A) Zebrafish early development. Fertilization (0 hpf, timescale on bottom) marks the onset of a series of rapid and synchronous cell divisions (developmental stages, middle) that exponentially increase the number of cells of the embryo, while depending only on maternally provided mRNAs (green). The MZT (3 hpf) marks the onset of zygotic transcription (purple) and clearance of maternal messages. (B) Using precursor and mature RNA expression to determine the expression source of early developmental transcripts. Histogram (bottom) shows fractions of transcripts (y axis) that are expressed only maternally (green, left), only zygotically (purple, middle) or from both sources (green/purple, right). Fraction and number of transcripts are indicated on top. Representative transcripts from each category are shown on top. Graphs show mature (red) and precursor (blue) RNA expression (y axis, logscale) over time (hpf; x axis), in either polyA+ (solid) or total-RNA (dotted) sequencing libraries. Black dashed line indicates MZT (3 hpf). While maternally expressed genes are enriched for basal cellular functions such as oxidative phosphorylation, ribosomal proteins and proteasome degradation, zygotic-only genes (e.g., eve, middle) are enriched for developmental regulators, including many transcription factors and signaling molecules. (C–G) Analysis of RNA stability. (C) A linear regression model (dashed red line) to infer maternal mRNA decay rate from expression levels (y axis, solid black line) over time (x axis). The model uses 3 parameters: an initial expression level (X0), onset time of degradation (td) and degradation rate (β). (D) Distribution (fraction of genes, y axis) of degradation start times (hpf, x axis). Black dashed line indicates MZT (3 hpf). (E) Distribution (fraction of genes, y axis) of maternal mRNA half-lives (hours, x axis) for pre-MZT decaying messages (<3 hpf, green) and post-MZT decaying messages (3-9 hpf, red). (F) Distribution (fraction of genes, y axis) of mean polyA tail lengths (x axis) of messages that are only maternal (left), only zygotic (middle) or both (right) as measured at 2hpf (black), 4hpf (blue) or 6hpf (red). The few zygotic-classified transcripts expressed at 2hpf (60 genes) mostly arise from errors in transcript annotations or in matching novel transcript annotations to the reference annotations. (G) Distribution of mean polyA tail length of maternal messages (x axis) at 2hpf (left), 4hpf (middle) and 6hpf (right) versus their translational efficiency (TE) (y axis, top row), mRNA stability as estimated by the model (y axis, middle row) and degradation start time as estimated by the model (y axis, bottom row). The Spearman correlation coefficient and associated p-value are marked on top of each panel, with significant results highlighted in bold. Based on these predictions, we find two major waves of degradation of maternal messages (D): 18% of messages start degradation immediately after fertilization (0-1 hpf), while another 47% start degradation only after MZT (3-5 hpf). Maternal mRNA half-lives range from tens of minutes to several hours (E) and are comparable to degradation rates in mammalian immune cells. Pre-MZT decaying messages (<3 hpf, e green) are degraded more slowly (KS-test p < 1029) than post-MZT decaying messages (3-9 hpf, e red), suggesting that a different degradation pathway is active pre-MZT. In zebrafish, a zygotically expressed miRNA (miR-430) contributes to clearance of maternal messages after MZT (Giraldez et al., 2006 and Schier, 2007). Indeed, only transcripts whose decay start between 3-4 hpf are enriched (p < 8.3x10¹¹) for the miR-430 seed sequence in their 32UTRs. This finding is consistent with and expands other recent findings that suggest that the zebrafish posttranscriptional regulatory program changes from a maternally derived control over mRNA translation (pre-MZT) into a zygotic regulation of mRNA stability (post-MZT) ( Subtelny et al., 2014). PolyA tail lengths correlate to mRNA translation rates pre-MZT (2-4 hpf) but not at later times (6hpf), and miRNA binding represses target translation pre-MZT, but induces target degradation post-MZT ( Subtelny et al., 2014). Our analysis provides further evidence for such reprogramming. First, we find that polyA tail lengths (as measured in |
Reprinted from Cell, 159(7), Rabani, M., Raychowdhury, R., Jovanovic, M., Rooney, M., Stumpo, D.J., Pauli, A., Hacohen, N., Schier, A.F., Blackshear, P.J., Friedman, N., Amit, I., Regev, A., High-Resolution Sequencing and Modeling Identifies Distinct Dynamic RNA Regulatory Strategies, 1698-710, Copyright (2014) with permission from Elsevier. Full text @ Cell

