
- Title
-
Immunoresponsive Gene 1 Augments Bactericidal Activity of Macrophage-Lineage Cells by Regulating β-Oxidation-Dependent Mitochondrial ROS Production
- Authors
- Hall, C.J., Boyle, R.H., Astin, J.W., Flores, M.V., Oehlers, S.H., Sanderson, L.E., Ellett, F., Lieschke, G.J., Crosier, K.E., and Crosier, P.S.
- Source
- Full text @ Cell Metab.
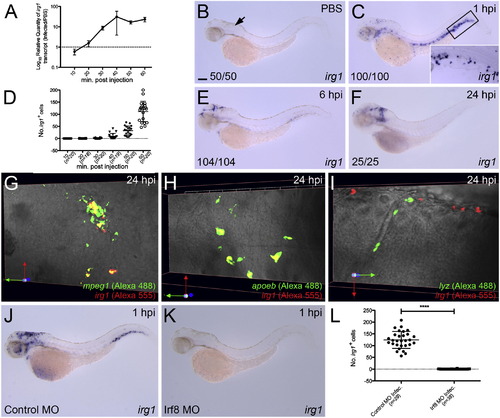
Macrophage-Lineage Cells Express irg1 in Response to Infection (A) Temporal QPCR analysis of irg1 expression within infected larvae (relative to PBS-injected controls) throughout first hour of infection, n = 3 biological replicates (mean ± SD). (B and C) Expression of irg1 within PBS-injected control and infected larvae at 1 hpi, respectively. Arrow marks hindbrain ventricle injection site. Inset, magnified view of boxed region of similarly treated larva (10× objective). (D) Quantification of irg1+ cells within individual infected larvae at 10, 20, 30, 40, 50, and 60 mpi (mean ± SD). (E and F) Expression of irg1 within infected larvae at 6 and 24 hpi, respectively. (G–I) Dual expression analysis of irg1 and mpeg1 (G), apoeb (H), and lyz (I) within the midbrain/hindbrain region of infected larvae at 24 hpi. (J and K) Expression of irg1 within infected control MO-injected and Irf8-depleted larvae, respectively, at 1 hpi. (L) Quantification of irg1+ cells within individual infected larvae as shown in (J) and (K) (mean ± SD). All views anterior to left. Numbers represent frequency of larvae with displayed phenotype. Scale bar, 100 µm in (B). p < 0.0001. See also Figure S1. EXPRESSION / LABELING:
PHENOTYPE:
|
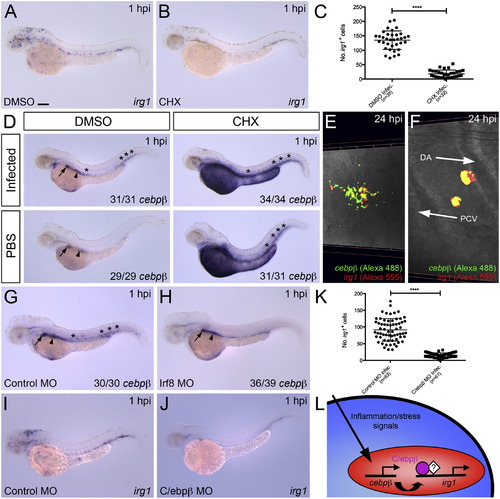
Infection-Responsive Expression of irg1 within Macrophage-Lineage Cells Is Dependent on the Primary Response Transcription Factor C/ebpβ (A and B) Expression of irg1 within infected DMSO (control)- and CHX-treated larvae, respectively, at 1 hpi. (C) Quantification of irg1+ cells within individual infected larvae as shown in (A) and (B) (mean ± SD). (D) Expression of cebpβ within DMSO (control)- and CHX-treated larvae, following infection or PBS injection, at 1 hpi. (E and F) Dual expression analysis of irg1 and cebpβ within the midbrain/hindbrain and trunk, respectively, of infected larvae at 24 hpi. (G and H) Expression of cebpβ within infected control MO-injected and Irf8-depleted larvae, respectively, at 1 hpi. (I and J) Expression of irg1 within infected control MO-injected and C/ebpβ-depleted larvae, respectively, at 1 hpi. (K) Quantification of irg1+ cells within individual infected larvae as shown in (I) and (J) (mean ± SD). (L) Schematic illustrating proposed regulation of infection-responsive irg1 expression within macrophage-lineage cells. Asterisks, arrows, and arrowheads mark blood-specific, liver-specific, and gut-specific cebpβ expression, respectively. All views anterior to left. Numbers represent frequency of larvae with displayed phenotype. Scale bar, 100 µm in (A). Abbreviations: DA, dorsal aorta; PCV, posterior cardinal vein; p < 0.0001. See also Figure S2. EXPRESSION / LABELING:
PHENOTYPE:
|
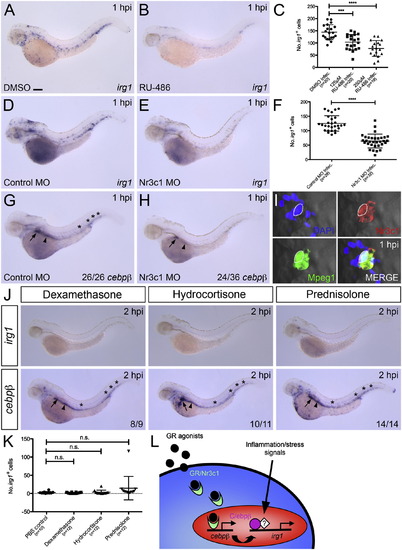
Glucocorticoid Receptor-Mediated Signaling Helps Regulate Infection-Responsive irg1 Expression within Macrophage-Lineage Cells through Induction of cebpβ Expression (A and B) Expression of irg1 within infected DMSO (control)- and RU-486-treated (250 µM) larvae, respectively, at 1 hpi. (C) Quantification of irg1+ cells within individual infected larvae treated with DMSO (control), 125 µM RU-486, or 250 µM RU-486 (mean ± SD). (D and E) Expression of irg1 within infected control MO-injected and Nr3c1-depleted larvae, respectively, at 1 hpi. (F) Quantification of irg1+ cells within individual larvae as shown in (D) and (E) (mean ± SD). (G and H) Expression of cebpβ within infected control MO-injected and Nr3c1-depleted larvae, respectively, at 1 hpi. (I) Immunofluorescence detection of Nr3c1 (Alexa 546) and Mpeg1/EGFP (Alexa 488) within DAPI-stained infected macrophage-lineage marking Tg(mpeg1:EGFP) larvae at 1 hpi. Dashed line marks Nr3c1+ nucleus. (J) Expression of irg1 and cebpβ within dexamethasone-, hydrocortisone-, and prednisolone-injected larvae at 2 hpi. (K) Quantification of irg1+ cells within individual larvae as shown in (J) (mean ± SD). (L) Schematic illustrating proposed regulation of infection-responsive irg1 expression within macrophage-lineage cells. Asterisks, arrows, and arrowheads mark blood-specific, liver-specific, and gut-specific cebpβ expression, respectively. All views anterior to left. Numbers represent frequency of larvae with displayed phenotype. Scale bar, 100 µm in (A). Abbreviations: p < 0.001; p < 0.0001; n.s., not significant. See also Figure S3. EXPRESSION / LABELING:
PHENOTYPE:
|
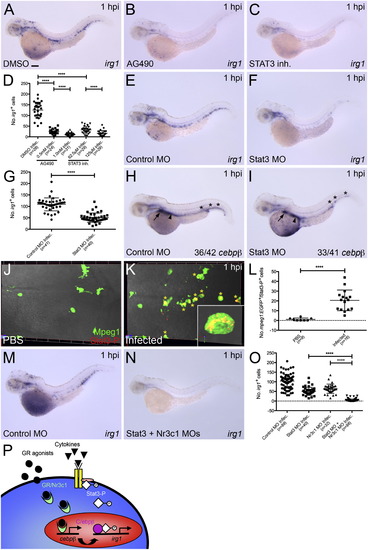
JAK/STAT Pathway Cooperates with Glucocorticoid Receptor-Mediated Signaling to Regulate Infection-Responsive irg1 Expression within Macrophage-Lineage Cells (A–C) Expression of irg1 within infected DMSO (control)-, AG490 (0.5 mM)-, and STAT3 inhibitor peptide (62.5 µM)-treated larvae, respectively, at 1 hpi. (D) Quantification of irg1+ cells within individual infected larvae treated with DMSO, AG490 (0.5 and 1.0 mM), or STAT3 inhibitor peptide (62.5 and 125 µM), at 1 hpi (mean ± SD). (E and F) Expression of irg1 within infected control MO-injected and Stat3-depleted larvae, respectively, at 1 hpi. (G) Quantification of irg1+ cells within individual infected larvae as shown in (E) and (F) (mean ± SD). (H and I) Expression of cebpβ within infected control MO-injected and Stat3-depleted larvae, respectively, at 1 hpi. (J and K) Immunofluorescence detection of phosphorylated Stat3 (Stat3-P, Alexa 568) and Mpeg1/EGFP (Alexa 488) within the midbrain/hindbrain region of PBS-injected and infected Tg(mpeg1:EGFP) larvae, respectively, at 1 hpi. Yellow asterisks mark macrophage-lineage cells containing phosphorylated Stat3. (L) Quantification of Stat3-P+ macrophage-lineage cells within the midbrain/hindbrain region of individual larvae as shown in (J) and (K) (mean ± SD). Region assessed, 100 µm from dorsal-most surface of midbrain/hindbrain (512 × 512, 50 z sections at 2 µm). (M and N) Expression of irg1 within infected control MO-injected and Stat3 + Nr3c1-depleted larvae, respectively, at 1 hpi. (O) Quantification of irg1+ cells within individual infected control MO-injected, Stat3-depleted, Nr3c1-depleted, and Stat3 + Nr3c1-depleted larvae, at 1 hpi (mean ± SD). (P) Schematic illustrating proposed regulation of infection-responsive irg1 expression within macrophage-lineage cells. Asterisks, arrows, and arrowheads mark blood-specific, liver-specific, and gut-specific cebpβ expression, respectively. All views anterior to left. Numbers represent frequency of larvae with displayed phenotype. Scale bar, 100 µm in (A). p < 0.0001. See also Figure S4. EXPRESSION / LABELING:
PHENOTYPE:
|
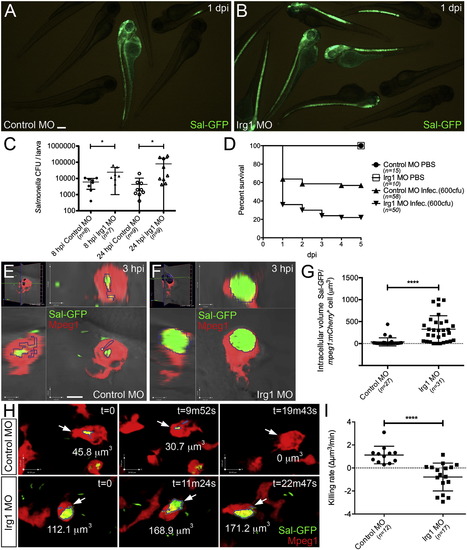
Irg1-Depleted Macrophage-Lineage Cells Demonstrate Diminished Bactericidal Activity (A and B) Live imaging of control MO-injected and Irg1-depleted larvae, respectively, following infection with Sal-GFP, imaged at 1 dpi. (C) CFU counts of remaining Sal-GFP within individual infected control MO-injected and Irg1-depleted larvae quantified at 8 and 24 hpi (mean ± SD). (D) Survival graph demonstrating percentage survival of control MO-injected PBS-injected, Irg1-depleted PBS-injected, control MO-injected infected, and Irg1-depleted infected larvae from 1 to 5 dpi. (E and F) Live confocal imaging of Sal-GFP within macrophage-lineage cells (within the midbrain/hindbrain region) of control MO-injected and Irg1-depleted Tg(mpeg1:mCherry) larvae, at 3 hpi, respectively. (G) Quantification of intracellular Sal-GFP burden within individual macrophage-lineage cells as shown in (E) and (F) (measured as total intracellular volume of Sal-GFP per mpeg1+ cell, mean ± SD). (H) Representative frames from live time-lapse confocal imaging of Sal-GFP infected macrophage-lineage cells within the midbrain/hindbrain region of control MO-injected and Irg1-depleted larvae (imaging starts at 3 hpi). White arrows mark tracked infected macrophage-lineage cell. Intracellular bacterial volume within tracked cells is displayed as µm3 within each time point. (I) Quantification of killing rate (change in Sal-GFP bacterial volume/time, Δµm3/min) of tracked infected macrophage-lineage cells, as shown in (H) (mean ± SD). Scale bars, 200 µm in (A); 5 µm in (E). p < 0.05; p < 0.0001. See also Figure S5. |
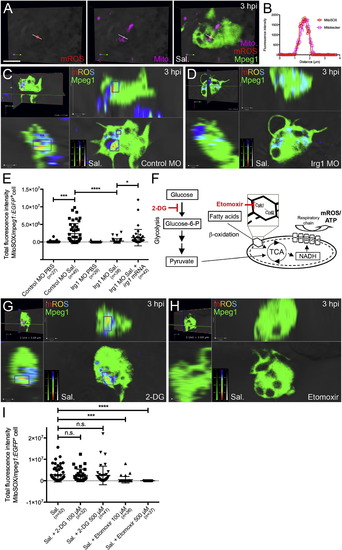
mROS Production within Macrophage-Lineage Cells Is Dependent on Irg1 and Fatty Acid β-Oxidation (A) Live confocal imaging of mROS production by macrophage-lineage cells within the midbrain/hindbrain region of Tg(mpeg1:EGFP) larvae at 3 hpi (following injection of Salmonella (Sal.), MitoSOX, and MitoTracker mitochondria-marking probes). (B) Line intensity profiles for MitoSOX and MitoTracker (for line shown in A) demonstrating overlapping signals and specificity of MitoSOX to the mitochondria of macrophage-lineage cells. (C and D) Live confocal imaging of mROS production by macrophage-lineage cells within the midbrain/hindbrain region of control MO-injected and Irg1-depleted Tg(mpeg1:EGFP) larvae at 3 hpi, respectively, following Salmonella and MitoSOX injection. MitoSOX fluorescence intensity is displayed as a colormap, with warmer colors representing higher signal intensities. (E) Quantification of mROS production by macrophage-lineage cells (measured as total fluorescence intensities of MitoSOX within individual mpeg1+ cells), as marked in (C), within control MO-injected and Irg1-depleted Tg(mpeg1:EGFP) larvae at 3 hpi, following PBS or Salmonella (Sal.) injection (mean ± SD). For the rescue experiment, 300 pg irg1 mRNA was coinjected with Irg1-targeting MOs. Five to ten larvae were sampled per treatment. (F) Schematic illustrating glucose and fatty acids as alternate energy sources for mitochondrial respiration and associated mROS production. Points of activity for 2-DG (glycolysis inhibitor) and the β-oxidation inhibitor etomoxir (specific for Cpt1) are marked. (G and H) Live confocal imaging of mROS production by macrophage-lineage cells within the midbrain/hindbrain region of Tg(mpeg1:EGFP) larvae at 3 hpi, following Salmonella (Sal.)/MitoSOX injection supplemented with 500 µM of 2-DG and etomoxir, respectively. (I) Quantification of mROS production by macrophage-lineage cells (as measured in G and H) following indicated treatments (mean ± SD). Five to ten larvae were sampled per treatment. Scale bar, 5 µm in (A). Abbreviations: n.s., not significant; p < 0.05; p < 0.001; p < 0.0001. See also Figure S6. EXPRESSION / LABELING:
PHENOTYPE:
|
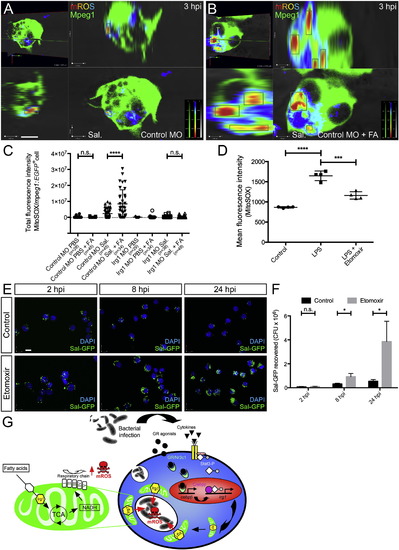
Irg1 Is Required for Enhanced mROS Production within Macrophage-Lineage Cells in Response to Fatty Acid Supplementation Inhibition of β-oxidation reduces LPS-stimulated mROS production and bactericidal activity of J774.2 murine macrophage-like cells. (A and B) Live confocal imaging of mROS production by macrophage-lineage cells within the midbrain/hindbrain region of control MO-injected Tg(mpeg1:EGFP) larvae, at 3 hpi, following Salmonella (Sal.)/MitoSOX injection alone or supplemented with an equimolar fatty acid mixture, respectively. MitoSOX fluorescence intensity is displayed as a colormap, with warmer colors representing higher signal intensities. (C) Quantification of mROS production by macrophage-lineage cells (measured as total fluorescence intensities of MitoSOX within individual mpeg1+ cells), as marked in (A) and (B), within control MO-injected and Irg1-depleted Tg(mpeg1:EGFP) larvae at 3 hpi, following the indicated treatments (mean ± SD). Five to ten larvae were sampled for each treatment. (D) Quantification of MitoSOX fluorescence, as detected by flow cytometry (measured as mean fluorescence intensity), within J774.2 murine macrophage-like cells treated with LPS alone (500 ng/ml) or supplemented with 50 µM etomoxir, compared to untreated, n = 4 biological replicates (mean ± SD). (E) Gentamicin protection assay showing infected DAPI-stained J774.2 cells (either untreated (control) or treated with 50 µM etomoxir) at 2, 8, and 24 hr postinfection (hpi) with Sal-GFP. (F) Quantification of recovered Sal-GFP following cell lysis and plating of samples, as shown in (E), n = 3 biological replicates (mean ± SD). (G) Model for Irg1/β-oxidation-dependent bactericidal mROS production. Scale bars, 5 µm in (A) and (E). Abbreviations: n.s., not significant; p < 0.05; p < 0.001; p < 0.0001. See also Figure S7. |
Reprinted from Cell Metabolism, 18(2), Hall, C.J., Boyle, R.H., Astin, J.W., Flores, M.V., Oehlers, S.H., Sanderson, L.E., Ellett, F., Lieschke, G.J., Crosier, K.E., and Crosier, P.S., Immunoresponsive Gene 1 Augments Bactericidal Activity of Macrophage-Lineage Cells by Regulating β-Oxidation-Dependent Mitochondrial ROS Production, 265-278, Copyright (2013) with permission from Elsevier. Full text @ Cell Metab.