
FIGURE 5
- ID
- ZDB-IMAGE-260731-27
- Genes
- Publication
- Gurberg et al., 2026 - Impaired Motor Function in a Zebrafish Stathmin-2 Knockout Model
- All Figures
- Figures for Gurberg et al., 2026
|
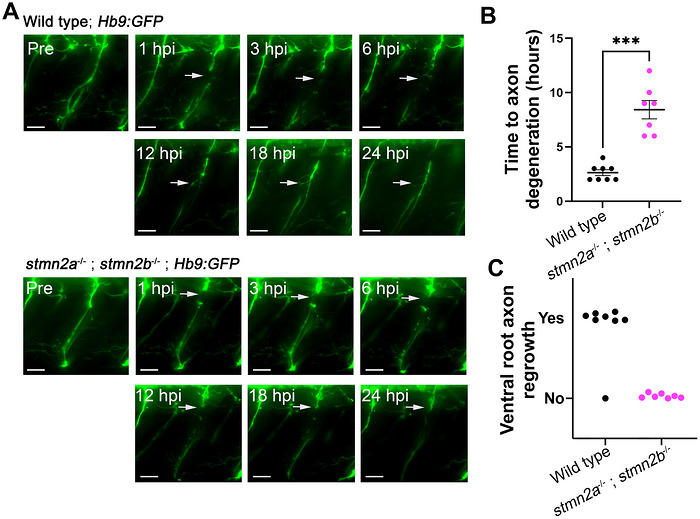
FIGURE 5
Delayed ventral root motor axon degeneration following axotomy in 2 dpf stmn2a−/−; stmn2b−/− zebrafish. (A) Example confocal images of ventral root motor axons of a wild type (top) expressing Tg[Hb9:GFP] and stmn2a−/−; stmn2b−/− zebrafish (bottom) expressing Tg[Hb9:GFP] over a 24 h period following injury (hpi). White arrows indicate location of axotomy. Scale bar represents 25 µm. (B) Quantification of the length of time it took for distal motor axon degeneration to occur. Axon degeneration time was significantly longer in stmn2a−/−; stmn2b−/− fish when compared to wild type zebrafish. Sample sizes are as follows: wild type, n = 8; stmn2a−/−; and stmn2b−/−, n = 7. Data points represent individual axon degeneration times from individual zebrafish with black bar representing the overall group mean ± standard error. A t‐test was used to make statistical comparisons. ***p < 0.001. (C) Tabulation of the number of ventral roots regrown at 24 hpi.