
Figure 8
- ID
- ZDB-IMAGE-260730-29
- Publication
- Zhang et al., 2026 - CFTR and ClC-3 Transport Fluoride Differently and Cause Dental Fluorosis in Different Ways
- All Figures
- Figures for Zhang et al., 2026
|
Figure 8
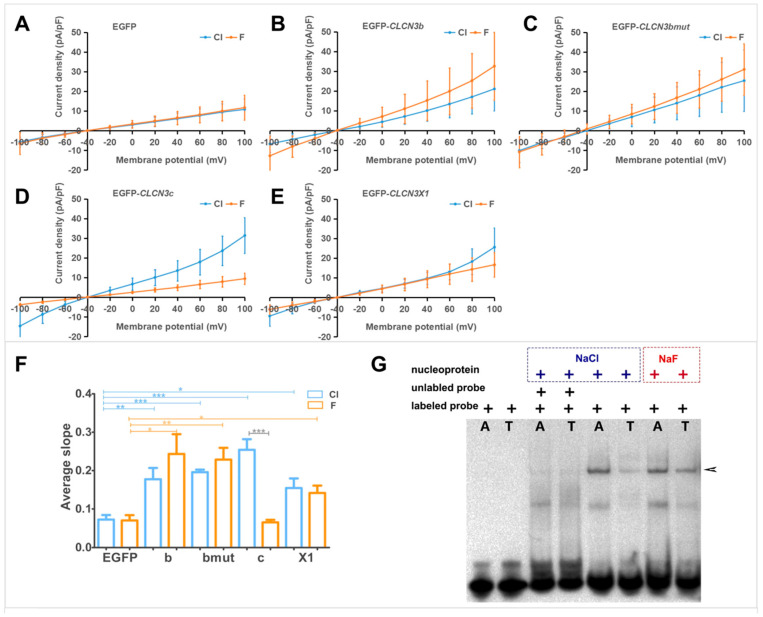
Function and regulation of different ClC-3 isoforms. (A–F) Chloride and fluoride transport properties of different ClC-3 isoforms. Whole-cell recordings were used to detect the chloride (blue curve) and fluoride (orange curve) currents in the HEK293 cells expressing ClC-3b, bmut, c, and X1. Four groups (ClC-3b, bmut, c, and X1) yielded ClC-3-specific chloride currents distinguishable from EGFP control cells and the ClC-3c group showed the highest amplitude. Fluoride current was recorded only in ClC-3b, bmut, and X1. ClC-3c group could not conduct any fluoride current (p < 0.001). Image (F) is the comparison of the average slope. n = 4~6. *: p < 0.05; **: p < 0.01; ***: p < 0.001. (G) EMSA results showing different binding effects of the rs10520161 A-allele or T-allele. Double-stranded DNA probes corresponding to the CLCN3 rs10520161 A-allele and T-allele were labeled with digoxigenin and incubated with nuclear extracts from HEK-293 cells. Both probes formed shifted complexes of similar mobility. Competition with excess unlabeled allele-specific probes abolished the shifts, confirming specific binding. Band intensities revealed that the A-allele probe bound more strongly than the T-allele probe in control extracts. In contrast, after exposure to excess fluoride, the T-allele probe generated a more intense shifted band than the A-allele probe, indicating that fluoride reversed the relative binding affinity. The arrow indicates the nucleoprotein–probe complex.