
Fig. 1
- ID
- ZDB-IMAGE-260723-18
- Genes
- Antibodies
- Publication
- Kaveh et al., 2026 - Flow-mediated endothelial remodeling and inflammation drive developmental vascular susceptibility in ldlr loss of function
- All Figures
- Figures for Kaveh et al., 2026
|
Fig. 1
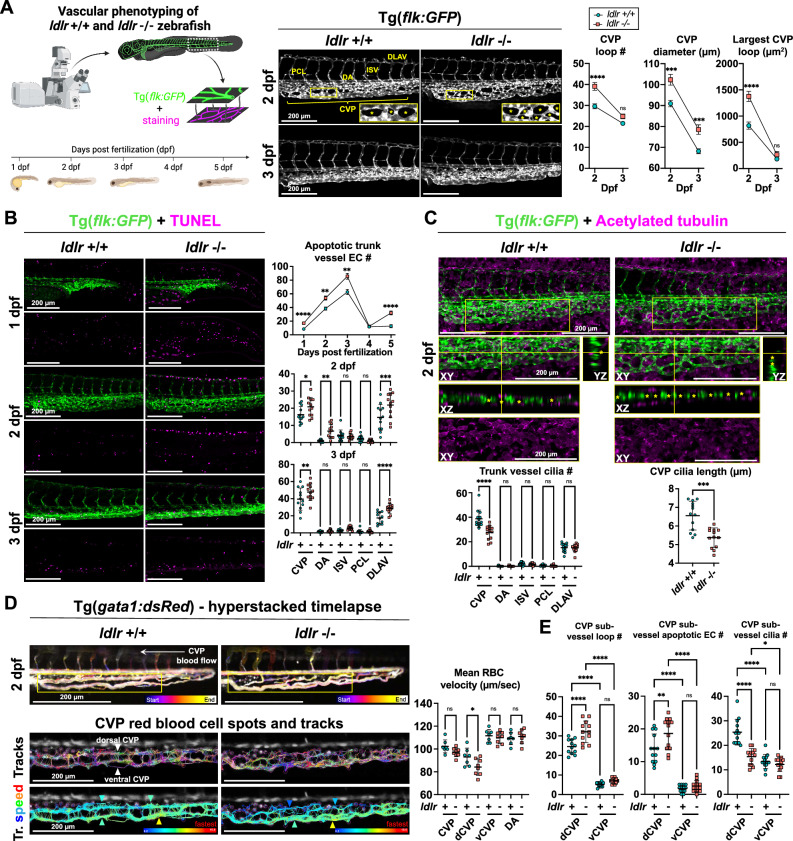
Embryonic ldlr-/- zebrafish display disrupted remodeling angiogenesis, enhanced endothelial apoptosis and reduced ciliogenesis.
A Schematic of developmental vascular phenotyping in ldlr + /+ and ldlr-/- zebrafish from 1-5 days post fertilization (dpf). Created in BioRender. Salazar, A. (2026) https://BioRender.com/7fk7msr (left). Confocal microscopy of Tg(flk:GFP) trunk vasculature at 2 dpf and 3 dpf. Trunk vessels from dorsal to ventral locations: DLAV (dorsal longitudinal anastomotic vessel), ISV (intersegmental vessel), PCL (parachordal lymphatic), DA (dorsal aorta) and CVP (caudal venous plexus). CVP indicated as a bifurcated vascular network and insets show CVP loops (asterisks); transient hollow structures remodeled at 3 dpf (middle). CVP metrics in ldlr + /+ (n = 12) and ldlr-/- zebrafish (n = 12): loop number at 2 dpf (p < 0.0001) and 3 dpf (p = 0.0793), diameter (μm) at 2 dpf (p = 0.0003) and 3 dpf (p = 0.0006) and largest loop area (μm2) at 2 dpf (p < 0.0001) and 3 dpf (p = 0.4036); 3 independent experiments. Data are mean ± s.e.m. Two-way ANOVA and Holm-Sidak’s multiple comparison used (right). B Confocal microscopy of TUNEL-stained trunk vasculature in ldlr + /+ and ldlr-/- zebrafish at 1-3 dpf (left). Number of apoptotic endothelial cells in the trunk vasculature of ldlr + /+ (n = 12-13) and ldlr-/- (n = 12-14) zebrafish at 1 dpf (p < 0.0001), 2 dpf (p = 0.0020), 3 dpf (p = 0.0020), 4 dpf (p = 0.7023) and 5 dpf (p < 0.0001); 3 independent experiments. Data are mean ± s.e.m. Two-way ANOVA and Holm-Sidak’s multiple comparison used (top, right). Number of apoptotic endothelial cells in trunk vessels between ldlr + /+ (n = 12) and ldlr-/- (n = 12) zebrafish at 2 dpf (middle, right) and 3 dpf (bottom, right). CVP 2 dpf (p = 0.0366) and 3 dpf (p = 0.0039), DA 2 dpf (p = 0.0085) and 3 dpf (p = 0.9419), ISV 2 dpf (p = 0.7391) and 3 dpf (p = 0.6444), PCL 2 dpf (p = 0.7391) and 3 dpf (p = 0.9728), DLAV 2 dpf (p = 0.0006) and 3 dpf (p < 0.0001); 3 independent experiments. Data are mean ± s.d. One-way ANOVA and Holm-Sidak’s multiple comparison used. C Confocal microscopy of acetylated tubulin-stained trunk vasculature in ldlr + /+ and ldlr-/- zebrafish at 2 dpf. Insets show maximum intensity projections (XY) and orthogonal z-slices (XZ and YZ planes) of CVP loops (asterisks) and associated cilia (middle). Trunk vessel cilia number (bottom left) and average CVP cilia length (bottom right, μm) in ldlr + /+ (n = 13) and ldlr-/- (n = 13) zebrafish. Cilia number: CVP (p < 0.0001), DA (p > 0.9999), ISV (p = 0.9971), PCL (p = 0.9971), DLAV (p = 0.0006). CVP length (p = 0.0001); 3 independent experiments. Data are mean ± s.d. One-way ANOVA and Holm-Sidak’s multiple comparison (bottom, left) and unpaired two-tailed t test used (bottom, right). D Red blood cell movement analysis in Tg(gata1:dsRed) trunk vasculature of ldlr + /+ and ldlr-/- zebrafish at 2 dpf. Hyperstacked time-lapse of red blood cell motility in the trunk vasculature, summarizing movement routes and activity relative to time (color-coded). Insets indicate CVP region used for tracking (top, left). Tracking of CVP red blood cells (spots) and analysis of movement routes (tracks). Red blood cell movement tracks through the dorsal CVP (dCVP, downward arrowheads) and ventral CVP (vCVP, upward arrowheads) are overlaid, and track speeds are color-coded (bottom, left). Mean red blood cell velocity (μm/sec) in the CVP, dCVP, vCVP and DA of ldlr + /+ (n = 7) and ldlr-/- (n = 8) zebrafish. CVP (p = 0.2545), dCVP (p = 0.0242), vCVP (p = 0.8216), DA (p = 0.8216); 2 independent experiments. Data are mean ± s.d. One-way ANOVA and Holm-Sidak’s multiple comparison used (right). E Quantification of dCVP and vCVP number (left), apoptotic EC number (middle), and cilia number (right) in ldlr + /+ (n = 12-13) and ldlr-/- zebrafish (n = 12-13) at 2 dpf. dCVP ldlr + /+ vs dCVP ldlr-/- (loop number: p < 0.0001, apoptosis: p = 0.0012, cilia number: p < 0.0001), vCVP ldlr + /+ vs vCVP ldlr-/- (loop number: p = 0.1918, apoptosis: p = 0.5353, cilia number: p = 0.3782), dCVP ldlr + /+ vs vCVP ldlr + /+ (loop number: p < 0.0001, apoptosis: p < 0.0001, cilia number: p < 0.0001), dCVP ldlr-/- vs vCVP ldlr-/- (loop number: p < 0.0001, apoptosis: p < 0.0001, cilia number: p = 0.0392); 3 independent experiments. Data are mean ± s.d. Two-way ANOVA and Holm-Sidak’s multiple comparison used. Source data are provided as a Source Data file.