
FIGURE 6
- ID
- ZDB-IMAGE-260720-13
- Publication
- Perone et al., 2026 - Aip mutation leads to significant alterations in gene expression, altered sensitivity to Ahr ligands, and early lethality in zebrafish
- All Figures
- Figures for Perone et al., 2026
|
FIGURE 6
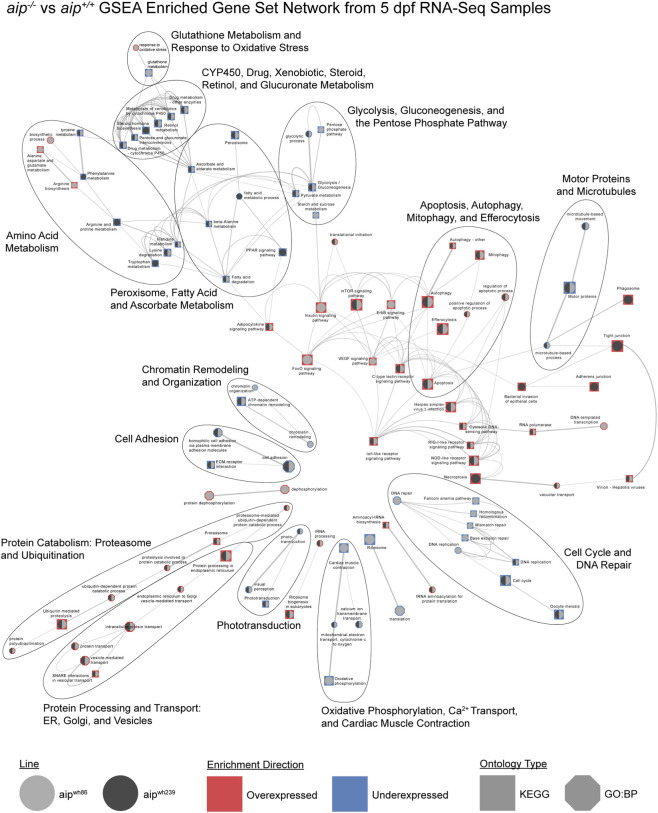
Network of KEGG and GO:BP terms enriched via GSEA (FDR ≤0.05) using aip−/− vs. aip+/+ gene expression changes from five dpf RNA-seq data. The network was generated by uploading GSEA results to the Enrichment Map app within Cytoscape. Line (aipwh86 and/or aipwh239) is denoted by the color (light and/or dark grey) of the foreground circle of each node. Enrichment direction (over or underexpression) is denoted by the color (red or blue) of the background shape of each node. Ontology type (KEGG or GO:BP) is denoted by the background shape (square or octagon) of each node. The size of the node and node connectors (edges) is determined by the number of genes in a gene set and the number of genes shared between nodes, respectively. 25% of genes in a smaller gene set must overlap with the larger gene set to be connected with an edge. Nodes with no connections were removed and are displayed in Figure 7. The ellipses were manually curated to highlight groups of three or more similar nodes. Individual gene set names can be viewed when the image is enlarged.