IMAGE

Fig. 5.

ID
ZDB-IMAGE-260624-63
Publication
Mertens et al., 2026 - Laminin α5 and integrins α3 and α6 coordinately regulate collective cell migration in vivo
All Figures
Figures for Mertens et al., 2026
Image
Figure Caption

Fig. 5.

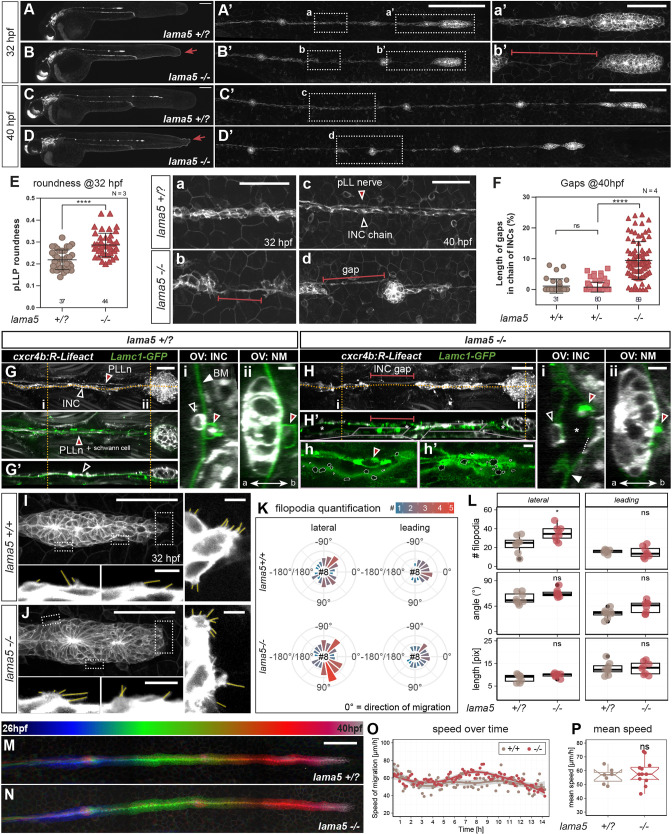
Laminin α5 is required in different aspects of LL morphogenesis. (A-D′) lama5+/? and lama5−/−cldnb:gfp embryos fixed at 32 hpf and 40 hpf (A-D), with magnifications of the pLL (A′-D′). Red arrows highlight the fransen fin phenotype. (a-d) Higher magnifications of areas indicated in A′-D′ showing the disrupted INC chain in lama5−/− embryos (a-d) and pLLP (a′,b′). (E) Quantification of pLLP roundness at 32 hpf. (F) Quantification of INC gap length relative to total LL length at 40 hpf. (G,H) MIPs of INC chain (cxcr4b:R-lifeact, black arrowhead) and BM (Lamc1-GFP) in 40 hpf embryos. Orange dashed lines indicate longitudinal (G′,H′) and transverse (i,ii) digital sections. (G,i) In lama5+/? siblings, the PLLn (cxcr4b:R-lifeact) surrounded by Schwann cells (Lamc1-GFP, together PLLn+) has translocated below the epidermal BM, while the INC chain resides on top (red and black arrowheads). (H,H′) In lama5−/− mutants, voids are found between epidermis and BM (H′, asterisks) and translocation of the PLLn is impaired (i). BM holes (outlined) do not correlate with INC gaps (h,h′). (I,J) Filopodia in control (I) and lama5 mutants (J). (K) Filopodia abundance binned by angle, with 0° being the direction of migration. Data are grouped in the lateral 90% and leading 10% of filopodia. Number of replicates are indicated inside the polar plots. (L) Statistical comparison of filopodia abundance, angle and length to control. (M,N) Temporally color-coded MIPs of 14-h time-lapse. (O) Loess model of instantaneous speed with mean values per time point; (P) average speed. (E,F) One-way ANOVA (E) with multiple comparisons (F) (dots indicate data from individual embryos; data are mean±s.d.). (L,P) Wilcoxon rank-sum test (dots indicate the mean of individual embryos; boxes indicate the median and IQR; whiskers indicate 1.5×IQR; in P, notches indicate 95% confidence interval). ns, non-significant. *P<0.05; ****P<0.0001. Scale bars: 200 μm in A-D′; 100 μm in M,N; 50 μm in a-d, a′,b′; 20 µm in G,H; 5 µm in Gi,Gii,Hi,Hii,h′; 5 µm in I,J (high magnification); 50 µm in I,J (low magnification). a, apical; b, basal.

Acknowledgments
This image is the copyrighted work of the attributed author or publisher, and ZFIN has permission only to display this image to its users. Additional permissions should be obtained from the applicable author or publisher of the image. Full text @ Development