
Figure 1.
- ID
- ZDB-IMAGE-260509-12
- Genes
- Publication
- Gillotay et al., 2026 - The role of Nrf2 in thyroid maturation and hormone synthesis in vertebrate models
- All Figures
- Figures for Gillotay et al., 2026
|
Figure 1.
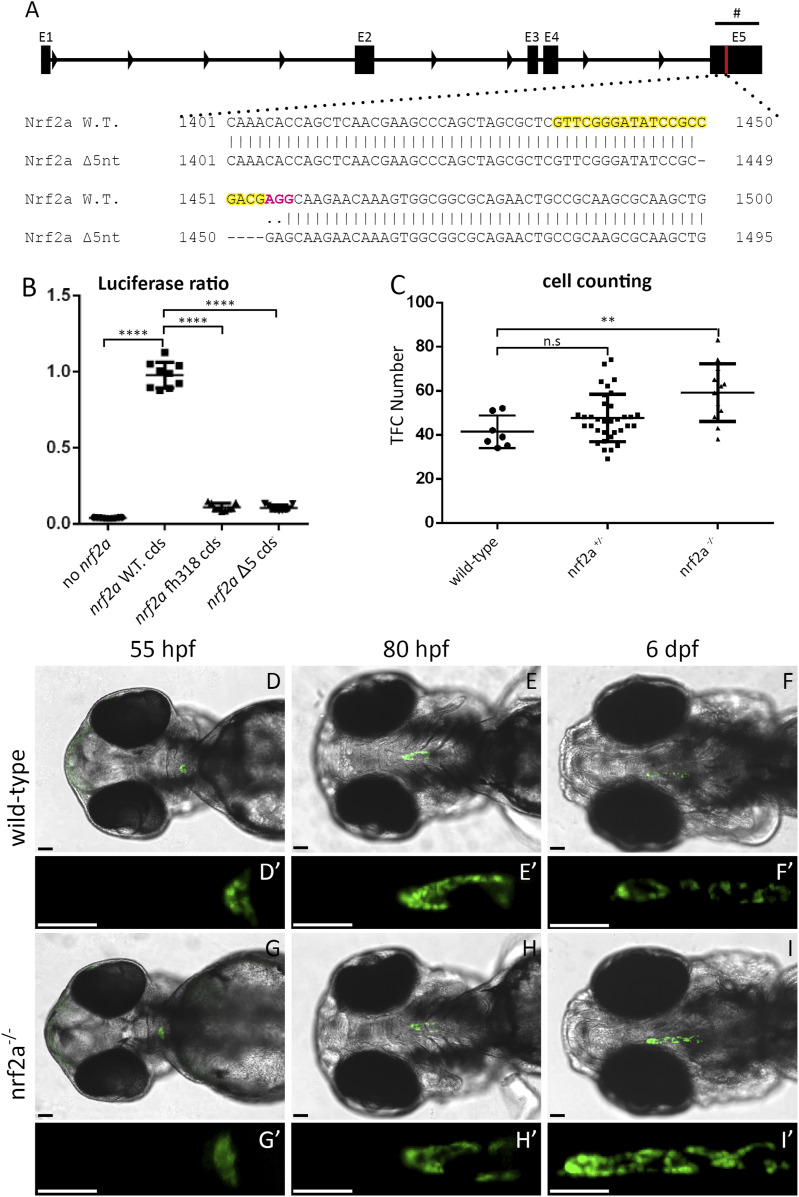
Live imaging of transgenic Tg(tg:nlsEGFP) zebrafish embryos carrying a 5-nt deletion in nrf2a allows real-time in vivo analysis of thyroid development.
(A) 5-nt deletion was generated in the exon 5 (E5) of the nrf2a gene resulting in a frameshift-inducing premature stop codon disturbing the DNA binding domain of the gene. The guide sequence is highlighted in yellow with the PAM sequence highlighted in magenta. (B) Activation of an ARE-driven luciferase reporter by WT and mutated nrf2a. HEK cells were transfected with plasmids encoding for the full-length coding sequences of a WT nrf2a, nrf2a fh318, or nrf2a Δ5 to evaluate their respective ability to drive luciferase expression. Results show that WT nrf2a (second from the left) can drive luciferase expression, whereas nrf2a fh318 and Δ5 cannot drive luciferase expression (third and fourth from the left, respectively). Results are shown as the mean ± SD. The asterisk denotes significant differences between positive control (WT nrf2a cds) and test conditions (****P < 0.0001, Dunnett’s multiple comparison test). (C) Quantification of thyroid follicular cell (TFC) number in individual WT (n = 7), heterozygous (n = 34), and homozygous mutant embryos (n = 12) shows a significant difference between WT and homozygous mutant. Results are shown as the mean ± SD. The asterisk denotes significant differences between groups of embryos (**P < 0.01, Kruskal–Wallis multiple comparison test). (D, E, F, G, H, I) show pictures of the whole head of a representative embryo at a specified developmental stage (ventral view, anterior is to the left). (D′, E′, F′, G′, H′, I′) show an enlarged picture of the thyroid region of the corresponding embryo. Epifluorescence microscopy of live Tg(tg:nlsEGFP) zebrafish reveals an increase in the thyroid size at 6 days post-fertilization (dpf) in the mutant embryos compared with their WT and heterozygous siblings. Live imaging also reveals that before 4 dpf, thyroid development shows no apparent differences between mutant, heterozygous, and WT embryos. Scale bars: 50 μm (D, D′, E, E′, F, F′, G, G′, H, H′, I, I′). “#” indicates the DNA binding domain of the nrf2a gene.