
Figure 5
- ID
- ZDB-IMAGE-260501-76
- Genes
- Antibodies
- Publication
- Kakiailatu et al., 2026 - Impact of enteric neuronal loss on intestinal cell composition
- All Figures
- Figures for Kakiailatu et al., 2026
|
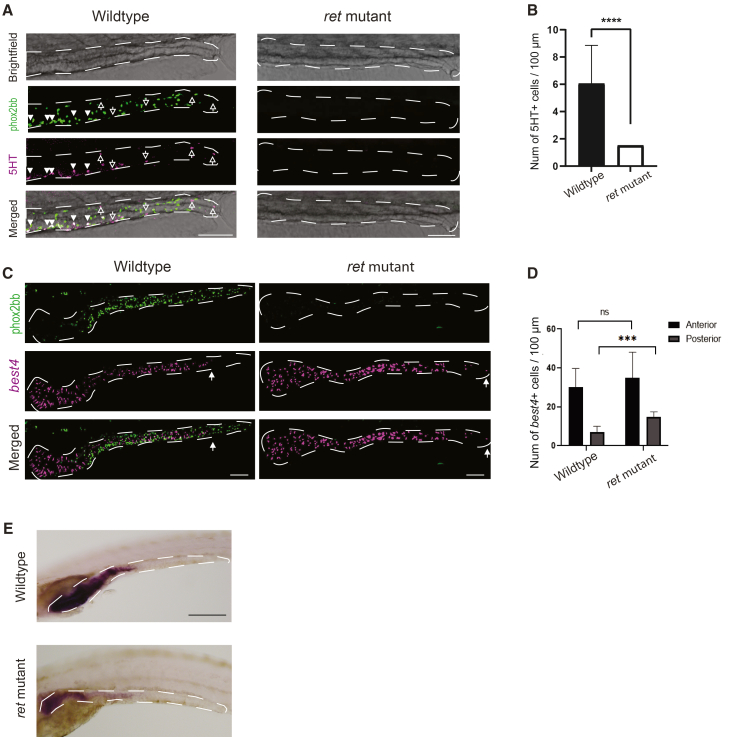
Figure 5
Altered epithelial composition in
(A) Maximum projections of immunohistochemistry staining of 5-HT in tg(phox2bb:GFP) wildtype (n = 14) and ret mutant (n = 12) zebrafish. Intestines are marked by the white dashed lines. Phox2bb+ cells are shown in green and 5-HT+ cells in magenta. Filled arrows without a tail indicate 5-HT+/Phox2bb+ cells, while unfilled arrows with a tail indicate only 5-HT+ cells. Scale bars represent 80 μm.
(B) Graph shows decreased numbers of 5-HT+ cells in ret mutant zebrafish (∗∗∗∗: p = 3,09918E-05, Welch’s t test).
(C) Fluorescent in situ hybridization of best4 in tg(phox2bb:GFP) wildtype and ret mutant zebrafish. Representative maximum projections from 5 dpf wildtype and ret mutant tg(phox2bb:GFP) zebrafish. Intestines are marked by the white dashed lines. Phox2bb+ cells are highlighted in green and best4+ cells in magenta. Filled arrows with a tail indicate the position of the last best4+ cell in the intestine. Scale bars represent 80 μm.
(D) Quantification of the number of best4+ cells in both anterior (ns: not significant, p = 0.128, Student’s t test) and posterior regions (∗∗∗: p = 0.021, Student’s t test) of the intestine, in wildtype (n = 10) and ret mutant zebrafish (n = 6).
(E) In situ hybridization of fabp2 in wildtype (n = 10) and ret mutant (n = 10) zebrafish, scale bars represent 200 μm.